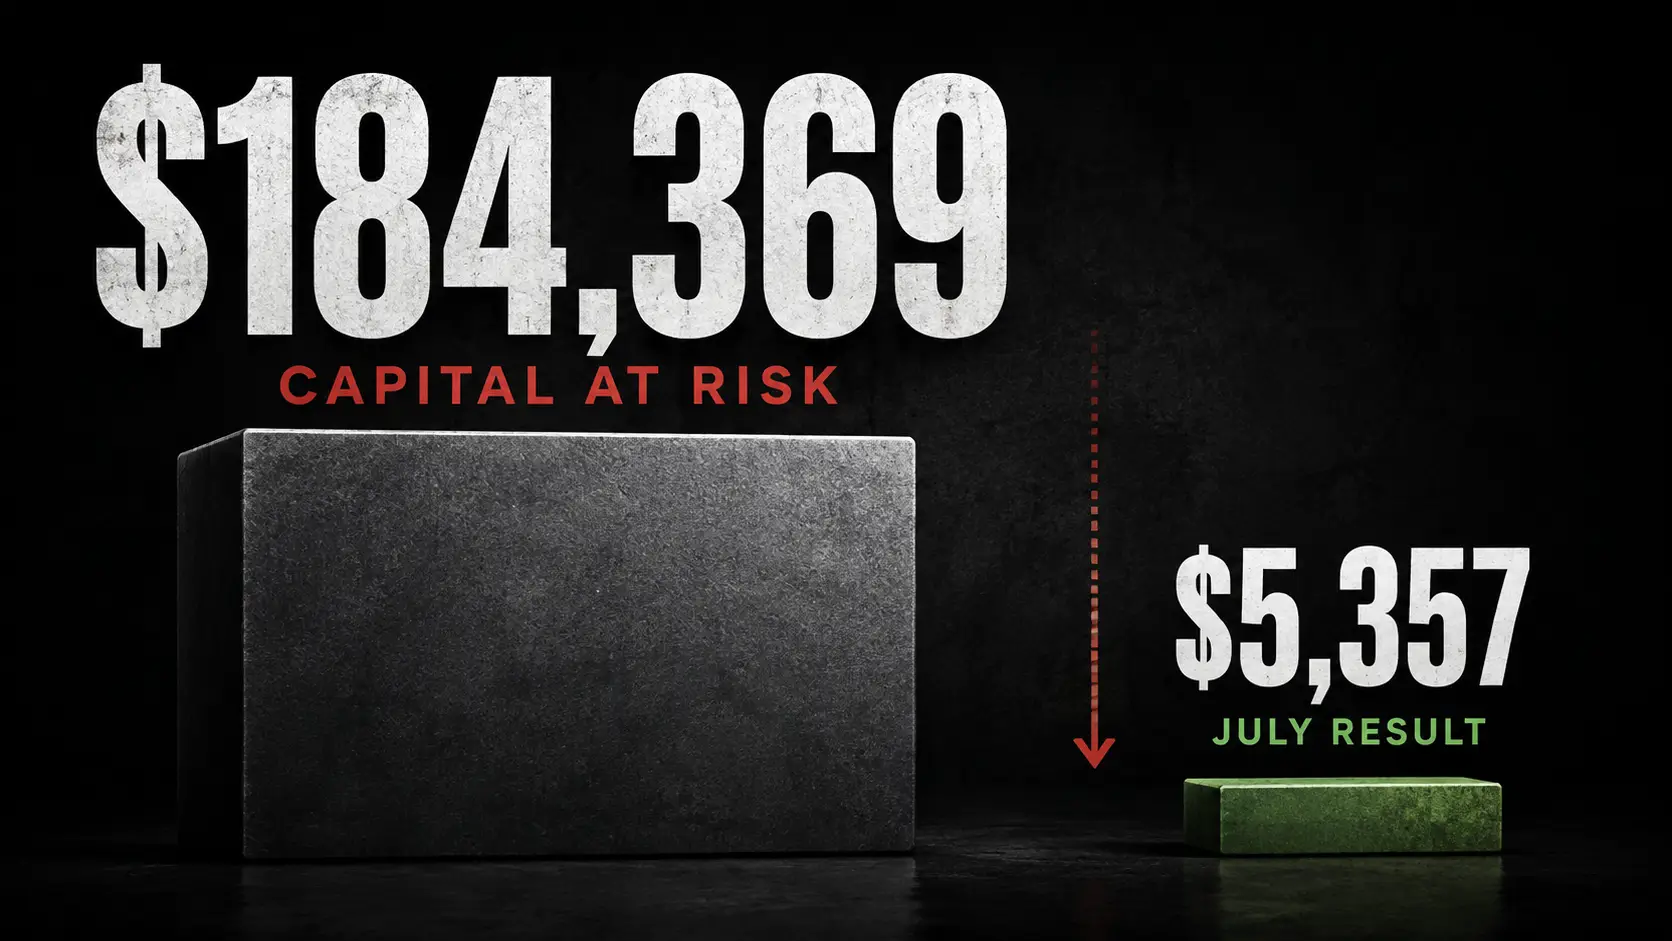
It took $184,369 to make $5,357
By Stephen Manning · @StephenCFU on X · · 3 min read
Everybody publishes what they made. Almost nobody publishes what it cost to hold the positions that made it. A member asked, so here is the whole month.
Everybody publishes what they made. Almost nobody publishes what it cost to hold the positions that made it. A member asked, so here is the whole month.
The question came in plain terms: how much margin is typically required to follow Uzi, Kyle and Dean at the same time?
It is the right question and almost nobody asks it. Most people ask what the returns are. This asks what you have to put on the table to be eligible for them.
What the number is, and is not
Roughly $124,000 of committed capital on an average day produced $5,357. That is about 4.3% for the month.
I am not going to turn that into an annual rate. One month is not a rate, and anyone doing that arithmetic in a sales email is selling you something. July was a good month. There have been worse ones and they sit on the same audited page as this one.
Every figure here is one contract per trade, the same basis our published results use. It is not any real member's account. It is what taking every single trade at one contract each would tie up.
Which means it scales. That is the whole answer to the question.
You do not have to follow all three traders, and you do not have to take every trade. The requirement per position is mechanical: a credit spread ties up the width of the spread minus the credit you collected, and that same number is the most you can lose. A five dollar wide spread taking $1.85 ties up $315.
Take a third of the trades at one contract and you need roughly a third of the capital, and you would have made roughly a third of the result.
Where the money actually sits
The headline is dominated by a handful of capital-heavy strategies. Strangles, cash secured puts and covered calls are share-backed or naked-side positions, and they carry almost the entire requirement.
That is the part worth sitting with. All eleven put credit spreads opened in July totalled $4,823 between them. Nineteen leap calls came to $31,391. Nine strangles came to $78,398.
The median position in the whole month risked $1,355. Thirty-two of the seventy-one positions risked under $1,000. The largest single one risked $20,580.
So the honest answer to "do I need six figures" is: to mirror everything, yes. To run the defined-risk side of the book, no, and it is not close.
Three things about these figures
The $5,357 counts closed trades only. Positions still open at the end of July counted as zero, so the result is understated against the capital shown rather than flattered by it.
Of the 72 positions open at some point during July, 71 had a risk figure recorded. One did not and is excluded. That is the entire discrepancy.
Peak and average are both given because a single "average margin" figure hides a swing from $86,254 to $184,369 inside one month.
What you cannot do is take the trades without the capital behind them. That is how people get hurt, and it is why we would rather publish an uncomfortable number than a flattering one.
The record is audited by CSH Analytics, independently, monthly, since April 2023. The losing trades are in it, which is the only reason the winning ones mean anything.
Figures are drawn from the audited trade record on a one-contract-per-trade basis. Past results are not a prediction of future results. Margin and buying-power requirements vary by broker and account type and may exceed the figures shown. Options carry risk including the total loss of premium paid. Nothing here is individual investment advice. Trade your own account at your own size.
Filed under: Risk Management