The 88: what actually happens when a credit spread goes against you
By Stephen Manning, President, Cash Flow University · · 7 min read
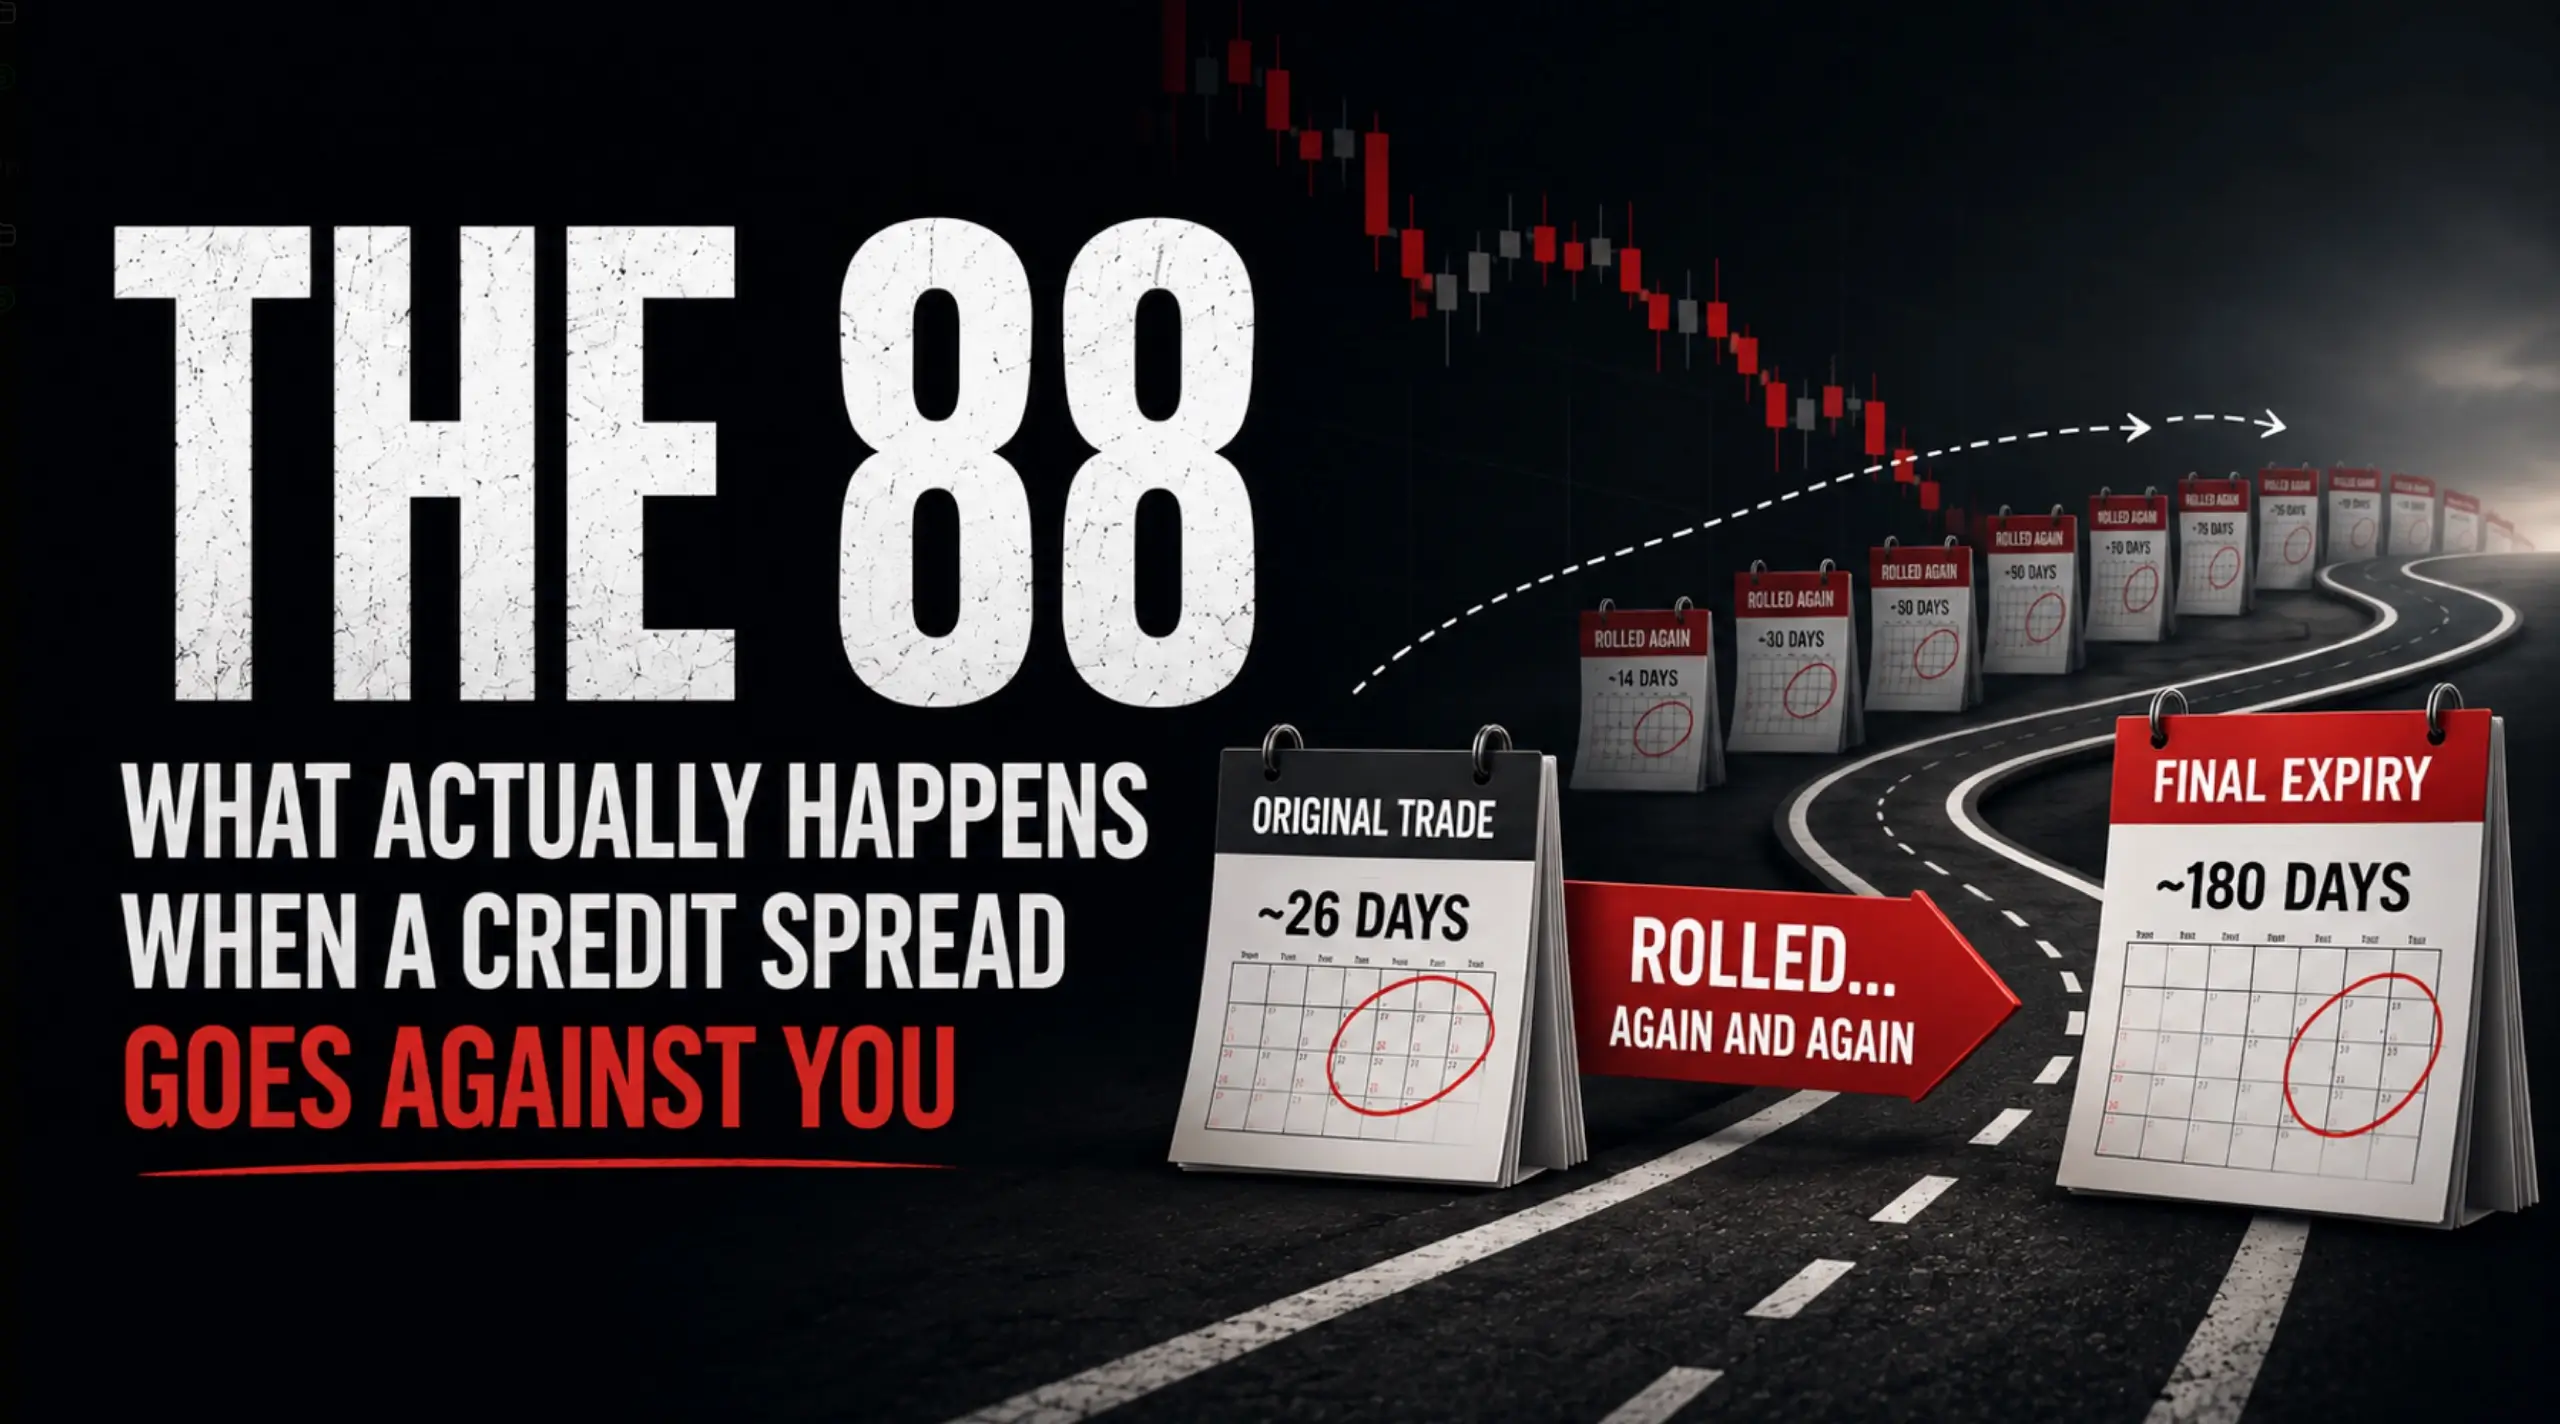
One in four of our 347 closed put credit spreads needed a roll. This is the anatomy of those 88: when we actually rolled, how much time each roll bought, and the cost almost nobody mentions, which is that 72 of the 88 came out carrying more risk than they went in with.
A member asked a sharp question this week: when a spread gets rolled, do we count it as a new trade or the same one?
Same one. The 347 closed put credit spreads in our record count campaigns, not legs. A spread rolled nine times is one trade with nine rolls written on it, not ten trades. Counting rolls as fresh trades would flatter the win rate, which is exactly why we do not do it.
That question deserves a longer answer though, because the 88 trades that needed rolling are the most instructive part of the whole record. Here is their anatomy.
What a roll actually is
Rolling means closing your current spread and opening a replacement further out in time, usually at lower strikes. You are paying to give a losing position more room and more time to be right.
Done well it is the difference between a temporary drawdown and a realized loss. Done badly it is how a small mistake compounds into a six month project. Both of those are in our record, so we can show you the difference instead of theorizing about it.
When we actually pull the trigger
First roll on each trade, the 77 of the 88 rolled spreads with a recorded roll date. Median: 7 days before expiry.
The median first roll happened seven days before expiry. Most of the time we act during the final two weeks, while there is still time value to work with and the position can be moved without paying panic prices.
The honest part: 17 of the 77 happened on expiry day or after it. Some of those were deliberate, letting the position breathe until the last moment. Some were slower than they should have been. The record does not flatter us here and we are not going to pretend otherwise.
What a roll buys you
Days from original expiry to final expiry across the 86 rolled spreads with both dates recorded. Median: 52 days of added runway.
The median roll bought 52 days. Think about that number against the original trade: these spreads open about 26 days from expiry, so a roll typically doubles the total life of the position.
The tail is long. The worst case in the record, a TSM spread, was rolled nine times and stretched from a nine day trade into a six month one. It is in the record with everything else.
The cost nobody mentions
Here is the number that surprised us when we counted: 72 of the 88 rolled spreads came out wider than they went in.
Wider means the gap between the strikes grew, and that gap is your maximum loss. So in 82 percent of our rolls, buying more time also meant carrying more risk. That is not a flaw in how we roll. It is usually the price of a roll that collects a credit instead of paying a debit. But it means a roll is not a free do-over, and anyone who tells you it is has not counted theirs.
The tickers that took the most rolling tell their own story: TSM needed nine roll events, DKS and AVGO seven each, TSLA and LLY six. Large, liquid names. Trouble does not only visit small stocks.
What to take from the 88
Three things, all from the record rather than from theory.
First, act in the final two weeks, not on expiry day. The trades that waited longest had the fewest options left.
Second, know that a roll will probably widen your risk before you make it. If the wider spread would break your position sizing, the roll was never really available, and the honest choice is between taking the loss and having sized smaller in the first place.
Third, decide your rule before you enter. The one in four is not an anomaly to be surprised by. It is a quarter of everything we have ever done with this strategy, at a record high or anywhere else. Write down what you will do when your short strike is breached, while you are calm, and month four becomes a procedure instead of a crisis.
Where the numbers come from
Every figure is a count or a date from our published trade record, audited by CSH Analytics, an independent third party, monthly and annually since April 2023. The losers and every one of the 88 rolls are in it. That is the part worth checking.
Every number in this piece comes from the same place: a trade record we publish as trades close, audited by an independent third party. Members see it live, including the positions currently open and the ones going wrong.
If that is the way you want to learn, the room is open.
SEE THE RECORDNo signup needed to read it.
Figures above are counts and timings of trades from our published record, not investment results. Past results are not a prediction of future results. Options carry risk including the total loss of premium paid. Nothing here is individual investment advice. Trade your own account at your own size.