What a put credit spread actually looks like, across 347 of them
By Stephen Manning, President, Cash Flow University ·
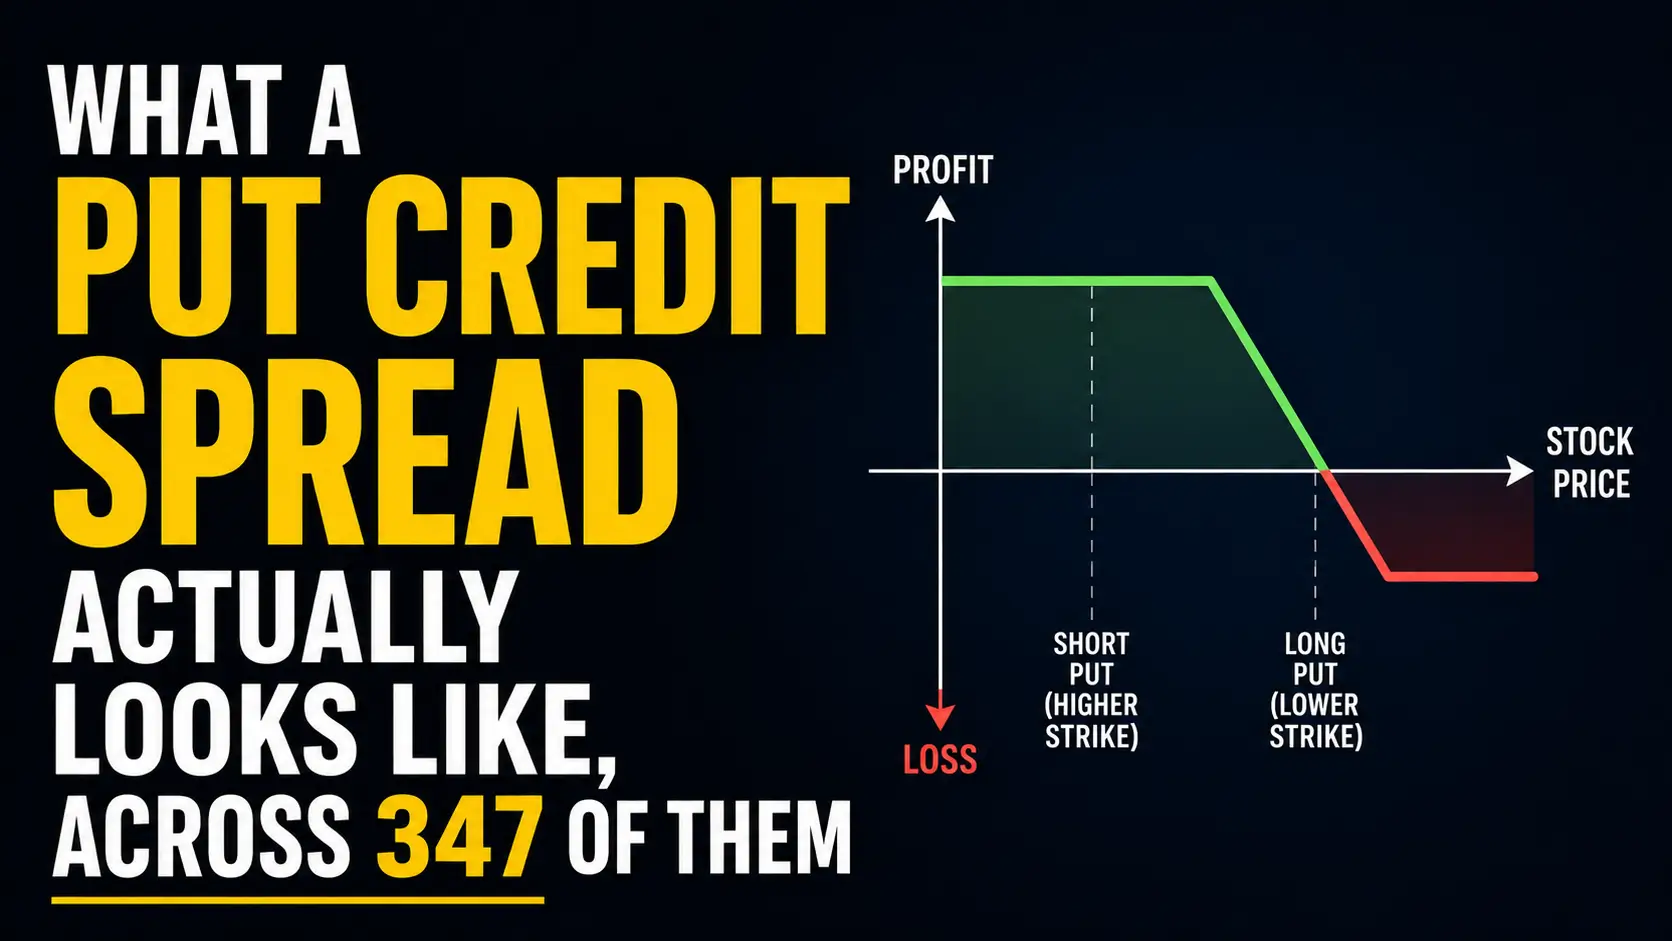
Most guides to put credit spreads are written from theory. This one is written from 347 closed trades in our own record: how far out we open them, how long we actually hold them, how wide they are, and what happened to the one in four that went against us.
Somebody asked me to walk through a put credit spread end to end. Entry, the mechanics of placing it, and what to do when it goes against you.
There is no shortage of articles explaining the theory. This is not one of those. Every number below comes out of our own record, 347 put credit spreads that we opened, managed and closed. It is the most-used strategy we have, 31% of every trade we have ever placed.
What the trade actually is
You sell a put at one strike and buy a put at a lower strike, both on the same stock, both expiring the same day. You take money in for doing it.
If the stock stays above your upper strike, both options expire worthless and you keep what you took in. If it falls through both, you lose the difference between the strikes minus what you were paid. That difference is the width, and it is the most you can lose. You know that number before you place the trade, which is the entire reason we use this structure so heavily.
It is a bet that a stock will not fall much before a set date. It is not a bet that it goes up.
How wide we build them
Spread width across all 347 closed put credit spreads. Source: CFU published trade record.
$5 wide is the default, 195 of 347. A $5 spread means the most you can lose is $500 per contract, less whatever you took in. If you took in $150, your real risk is $350 and your best case is $150.
That ratio is worth sitting with. You are risking more than you can make. It works because you do not need to be right often, you need to be right usually, and the strike sits far enough below the stock that usually is achievable.
How far out we open them, and how long we keep them
We open them a median of 26 days from expiry.
We hold them a median of 17 days.
Days from entry to close, all 347 closed put credit spreads. Median hold was 17 days against a median 26 days to expiry at entry.
So the typical trade is closed with a week or so still on the clock. A quarter of them close inside the first seven days.
That is deliberate. The last week of a spread's life is where the money you have left to make is smallest and the trouble you can get into is largest. Taking most of the profit and leaving is not weakness, it is the trade working as intended.
The part nobody writes about
One in four of them did not go to plan.
Of the 347 we have closed, 259 needed nothing at all. 88 needed at least one roll. Rolling means closing the position and reopening it further out in time, and usually further down in price, to give the trade more room.
Most of the trouble was small. 57 needed one roll and went away. Seventeen needed two. Eleven needed between three and five. Three needed six or more.
The worst one was a TSM spread opened on the 17th of December with an expiry nine days later. It closed on the 4th of June, rolled nine times, with the final expiry pushed out to the following June. Six months of work on a trade that was meant to take nine days.
It did not blow up. It became a job. That is what going wrong actually looks like in this strategy, and it is why the entry is the easy part.
What to do in month four
If you take one thing from this, take this: decide what you will do when it goes against you before you place it, not after.
The people who struggle with credit spreads are almost never the ones who picked a bad entry. They are the ones who had no plan for the fourth week, watched the stock come down through the short strike, and froze between taking the loss and hoping. This matters most when everything on the screen looks calm, which is exactly the condition we wrote about when the S&P 500 set a record high.
Having a rule you wrote down while you were calm is worth more than any entry filter.
Where the numbers come from
Every figure here is from our published trade record, audited by CSH Analytics, an independent third party, on a monthly and annual review of the raw record since April 2023. The losers are in it. That is the part worth checking, and it is why we can tell you one in four needed a roll instead of quietly leaving it out.
Every number in this piece comes from the same place: a trade record we publish as trades close, audited by an independent third party. Members see it live, including the positions currently open and the ones going wrong.
If that is the way you want to learn, the room is open.
SEE THE RECORDNo signup needed to read it.
Figures above are counts and timings of trades from our published record, not investment results. Past results are not a prediction of future results. Options carry risk including the total loss of premium paid. Nothing here is individual investment advice. Trade your own account at your own size.