Iron Condor Explained: 3 Real Trades on SPX
By Stephen Manning · @StephenCFU on X · · 11 min read
How an iron condor works, its four numbers and how often it needs to win, through three real trades on SPX and MDB (MongoDB), one of them a full loss.
An iron condor is four options at once: you collect a credit up front, and you keep the most when the stock stays inside a range. Our trader Uzi has closed 32 of them this year, and here are three of them.
Two were on SPX (the S&P 500 index) and one on MDB (MongoDB). One kept the whole credit, one closed early with most of it, and one lost the most it could.
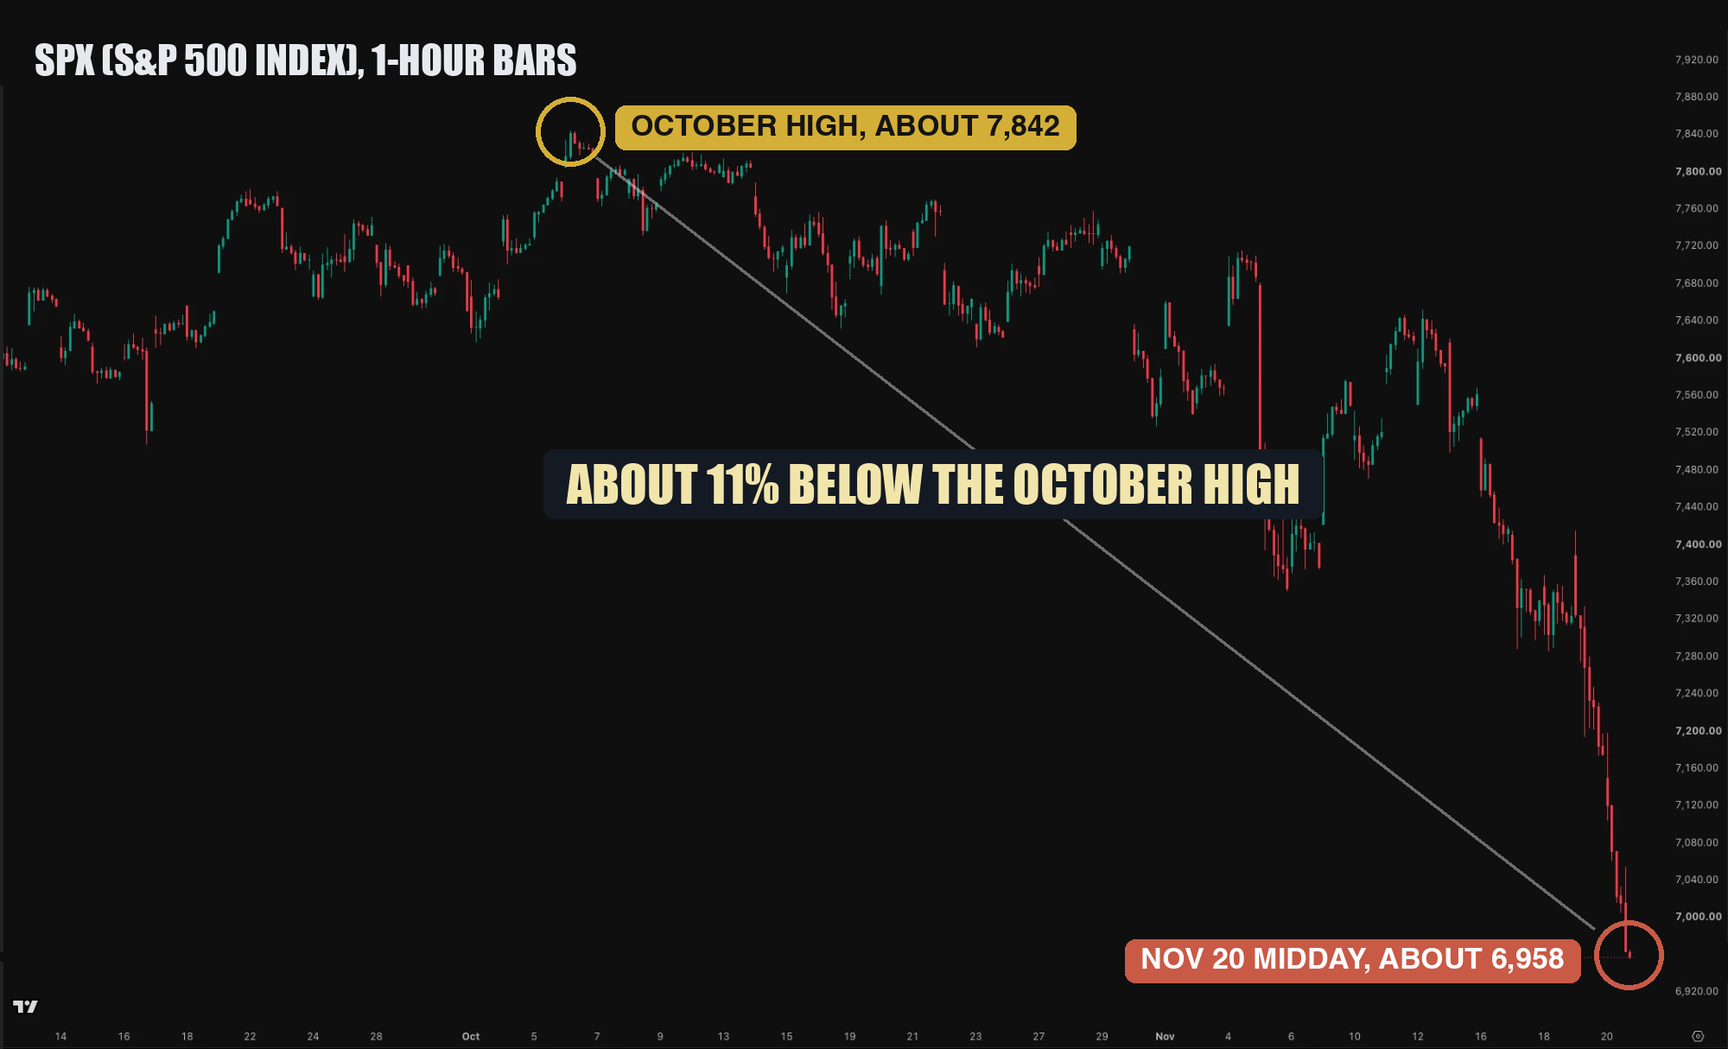
The timing matters. On my TradingView chart at midday on November 20, 2026, SPX was about 11% below its October high, about 6,958 against about 7,842. A trade that pays when prices stay in a range gets tested in a market like this one.
I'm Stephen, from Cash Flow University. This is education, and none of it is advice. The trades are from our public trade record, as Uzi posted them to our members, one contract each and before fees.
What is an iron condor?
An iron condor is two credit spreads opened together: a put spread below the stock price and a call spread above it. In each spread you sell one option, buy a cheaper one further from the stock price, and collect the difference, called the credit.
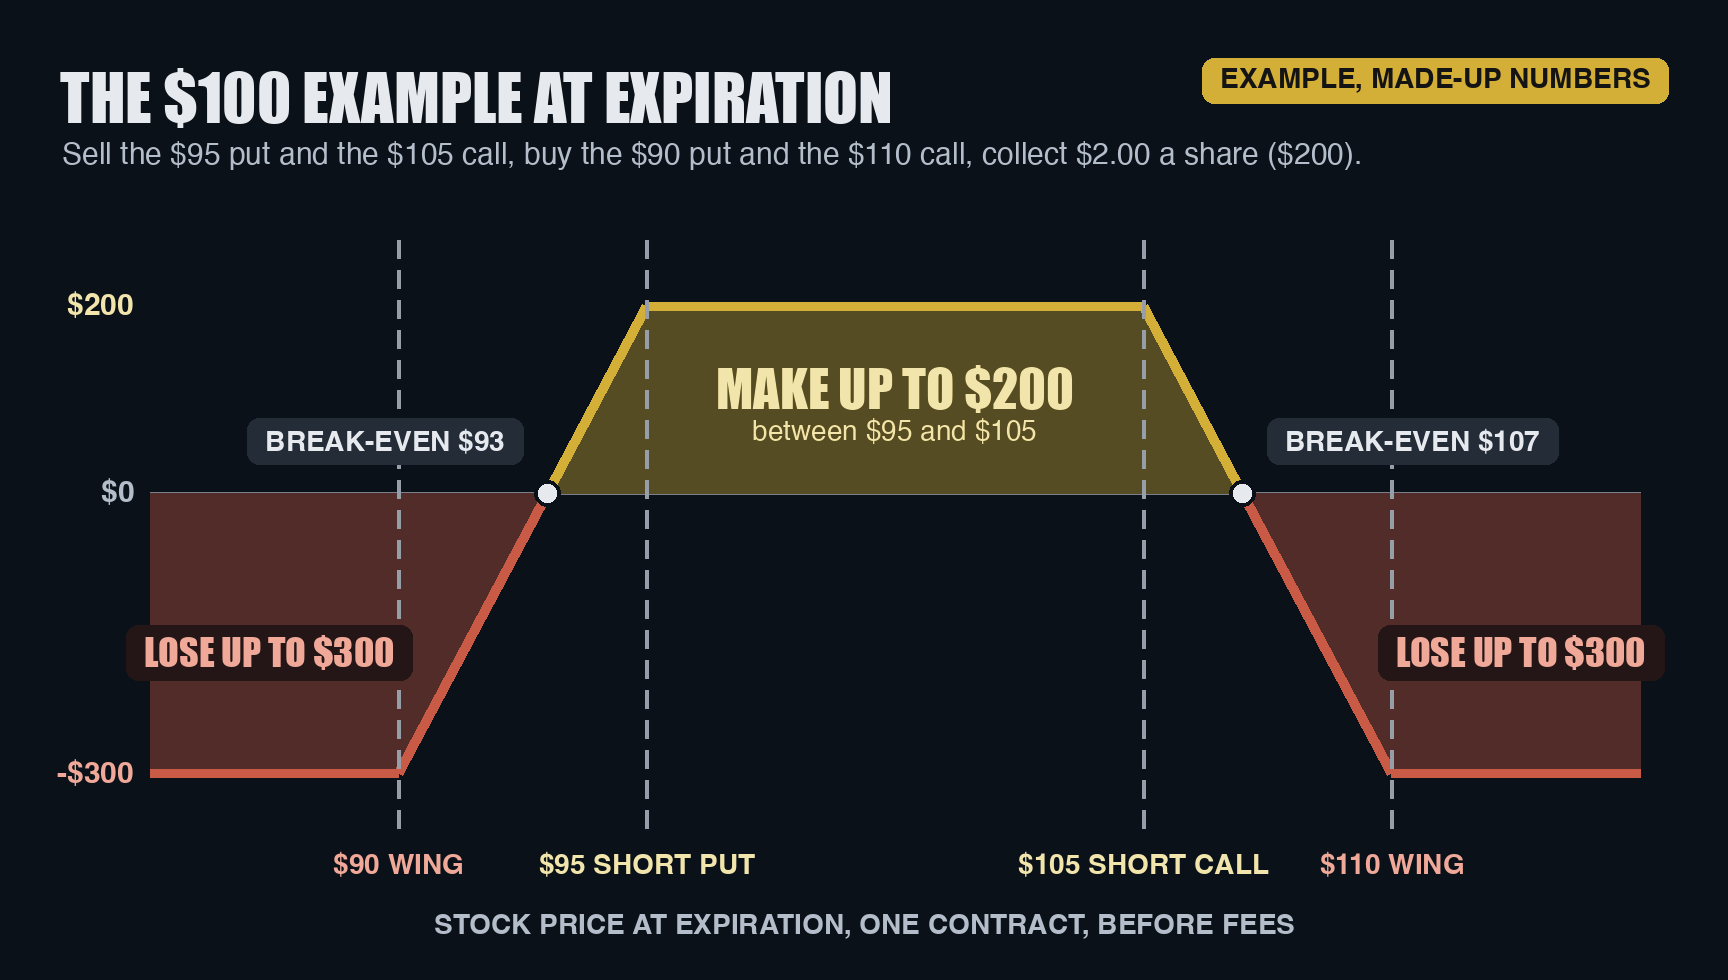
Here's a simple example with made-up numbers. A stock trades at $100. You sell the $95 put and buy the $90 put, and you sell the $105 call and buy the $110 call. If each spread pays $1.00 a share, that's $2.00 a share, or $200 on one contract, paid up front.
An option is a contract on 100 shares, and its price, called the premium, is quoted per share. A put gains as the stock falls below its strike price, and a call gains as the stock rises above it. The two options you sell are the short strikes. The two you buy are the long strikes, often called the wings, and they cap the loss. On a profit chart the trade looks like a bird with a wide flat body and two wings, which is where the name comes from.
What's the most an iron condor can make and lose?
The most you can make is the credit, $200 in the example. You keep all of it if the stock finishes between $95 and $105 at expiration, the last day an option exists, because all four options expire worthless.
The most you can lose is the width of one spread minus the credit. Each spread is $5 wide, or $500 on one contract, and only one side can lose at expiration, since the stock can't finish below $95 and above $105 at the same time. So the most you can lose is $500 minus $200, which is $300.
The other two numbers are the break-evens, the stock prices where you finish with no gain and no loss. The low one is the put you sold minus the credit, $93, and the high one is the call you sold plus the credit, $107. Between them at expiration you make money. Outside them you lose, up to $300.
Before fees, $300 is the most this example can cost at any time, however far the stock moves, because the trade can never be worth more than one spread's width.
How often does an iron condor need to win?
In the example you risk $300 to make $200. If every trade either kept the whole credit or lost the most, you'd need to win 6 times out of 10 just to break even: 60 wins of $200 is $12,000, and 40 losses of $300 is $12,000.
That's a simplification, since real trades often close somewhere in between, but it shows the shape of the trade. On the same simplification, Uzi's first SPX trade ($260 credit, $740 at risk) needed to win about 74 times in 100, and his second ($345 credit, $655 at risk) about 66.
Why do traders use iron condors?
You don't need to pick a direction, only a range. And time works for you: options lose a little value every day as expiration gets closer, which is called time decay, and when you've sold options that works in your favor as long as the stock stays in range.
You also get paid more when options are expensive, which happens when the market expects bigger moves. Traders call that high implied volatility. After a selloff like this one, options usually cost more, so condors pay more, and bigger swings come with that. And the risk is known the moment you open the trade.
The kind of day an iron condor doesn't like
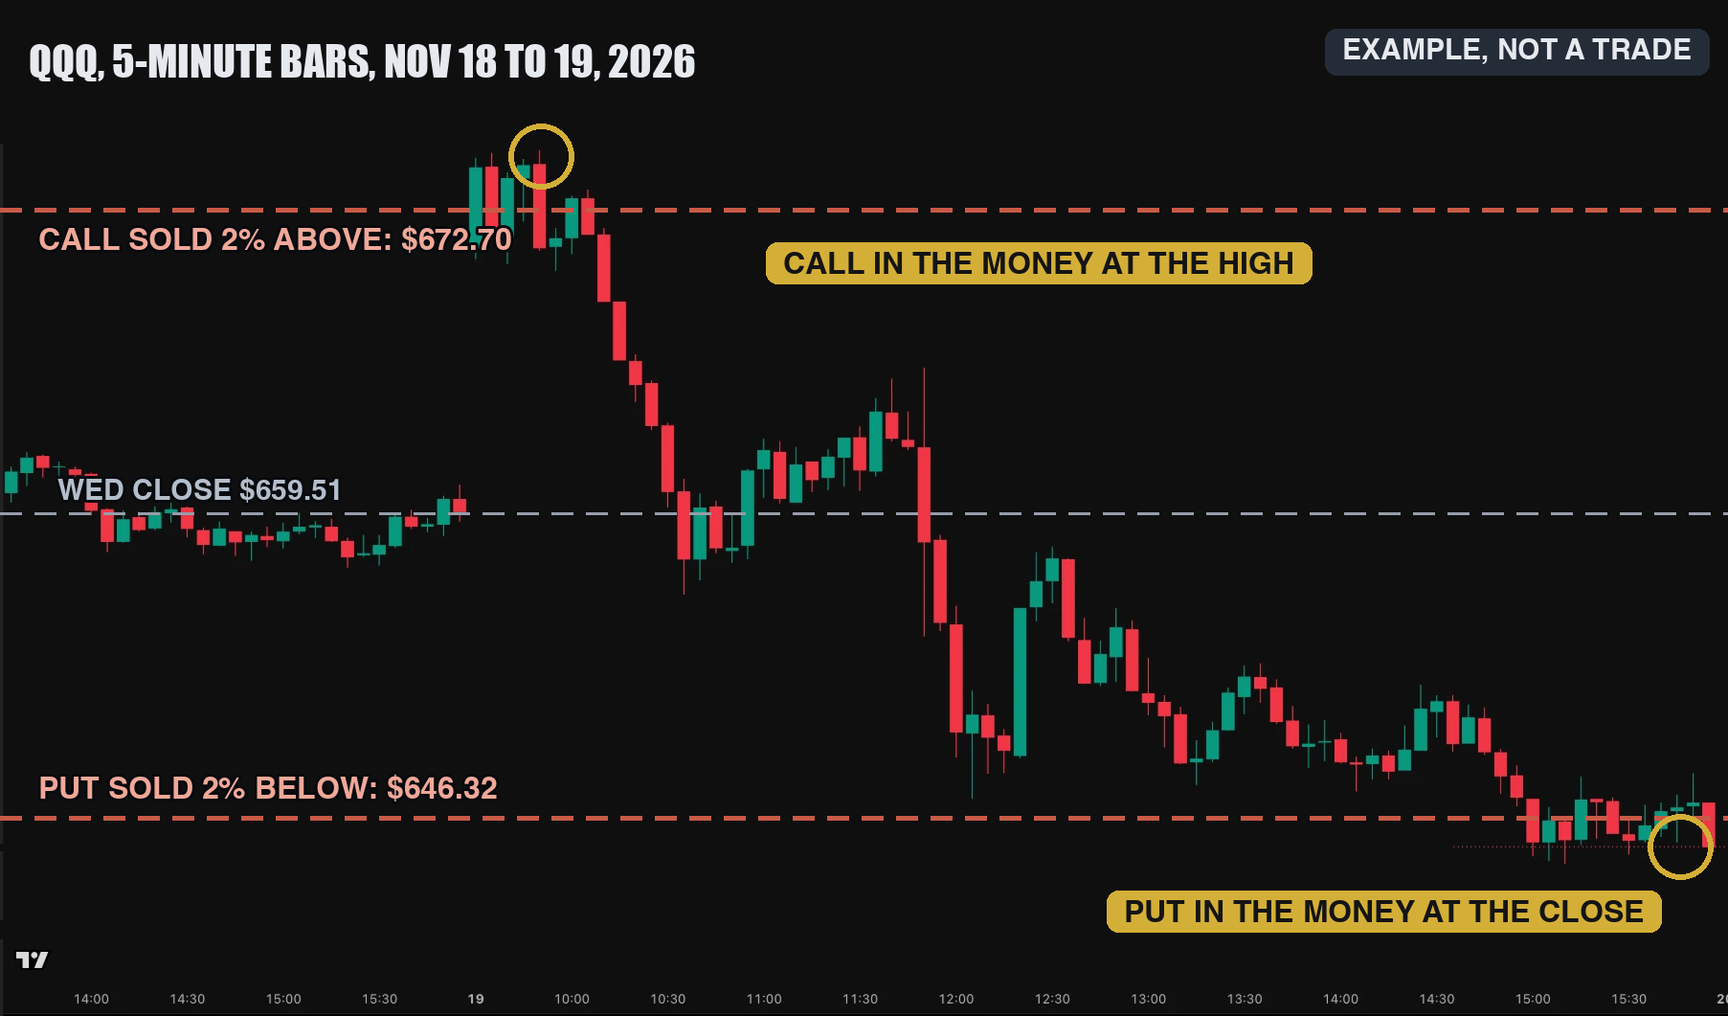
Thursday, November 19, 2026 was one. QQQ (Invesco QQQ Trust), the Nasdaq-100 fund, traded more than 2% above Wednesday's $659.51 close, with a high of $676.49, and then closed down 2.19%, at $645.04.
Picture a condor, as an example only, with short strikes 2% either side of Wednesday's close, at about $672.70 and $646.32. Its call was in the money at the high and its put was in the money at the close. Even on a day like that, only one side can lose at expiration, and the wings cap that loss.
Uzi's three iron condors
Trade one: SPX, the whole credit
SPX is the S&P 500 index itself. Two things make it popular for iron condors: it has no earnings reports, and it settles in cash, so you never end up holding shares.
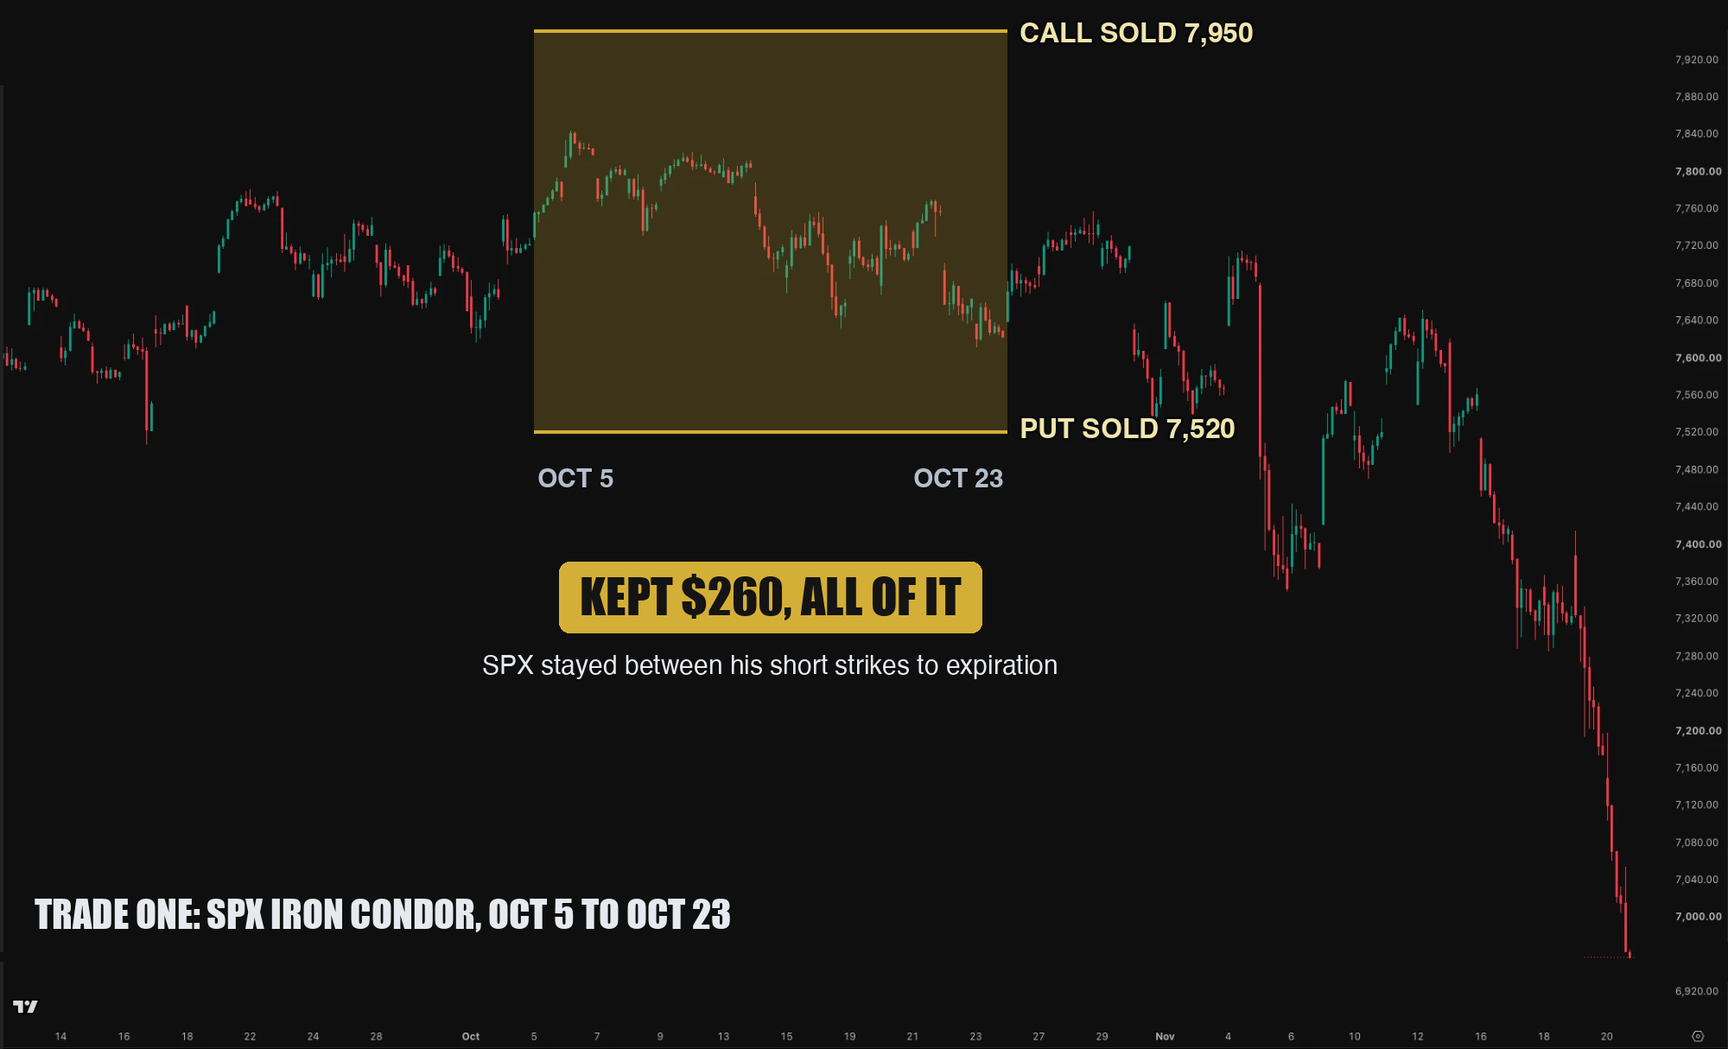
On Monday, October 5, 2026, Uzi sold the 7,520 put and the 7,950 call on SPX, each side 10 points wide, with 18 days to expiration on Friday, October 23. He collected $2.60 a share, $260 on one contract. Ten points wide is $1,000 a contract, so the most it could lose was $740.
At expiration, SPX finished between his short strikes and all four options expired worthless. He kept the whole $260.
Trade two: SPX, closed early
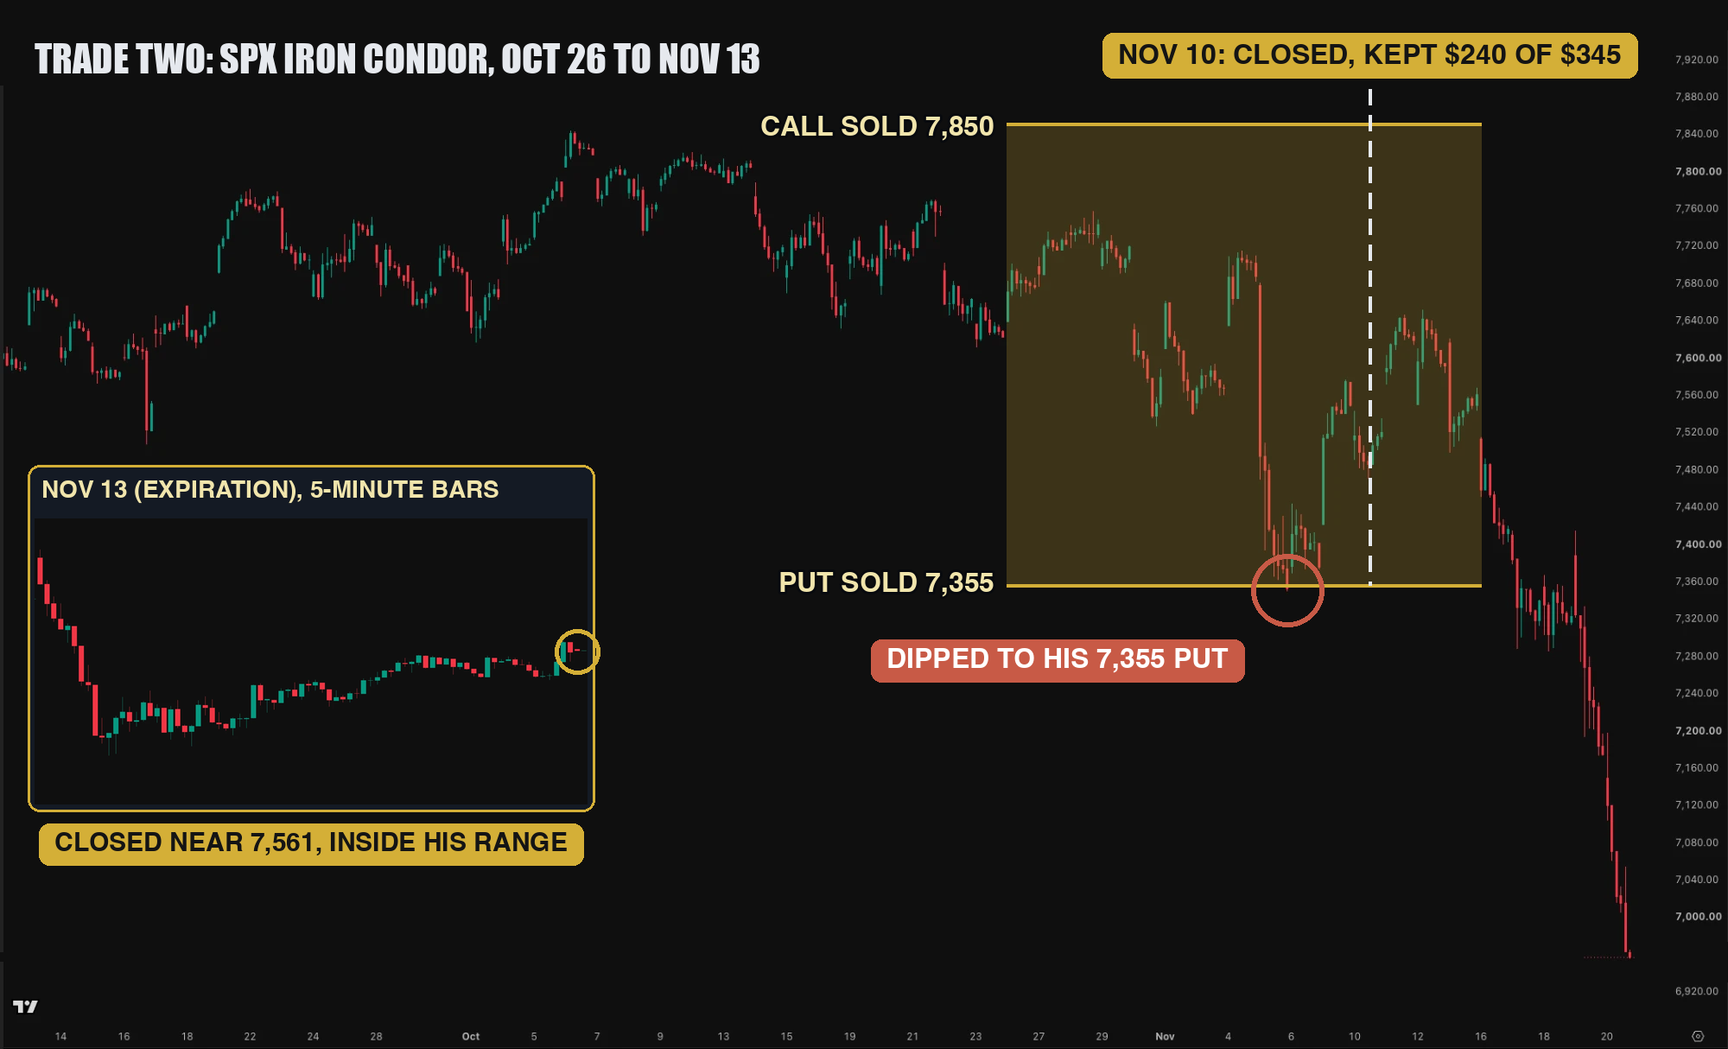
On Monday, October 26, he sold the 7,355 put and the 7,850 call, again 10 points wide, for expiration on Friday, November 13. He collected $3.45, or $345, with $655 at risk.
The put side got tested. Around November 5 and 6, SPX dipped to about 7,350 on my chart, right at his 7,355 put, then bounced. On Tuesday, November 10, three days before expiration, he bought the whole condor back for $1.05, or $105, and kept $240, about 70% of the credit.
Holding on for the last $105 meant the full $655 loss was still possible, and near expiration a small move in the index can swing an option's price fast. This time SPX closed November 13 near 7,561, inside his range, so holding would have kept all $345. Plenty of traders close early like this once most of the credit is in, knowing the last part sometimes would have come in anyway.
Trade three: MDB, the risk
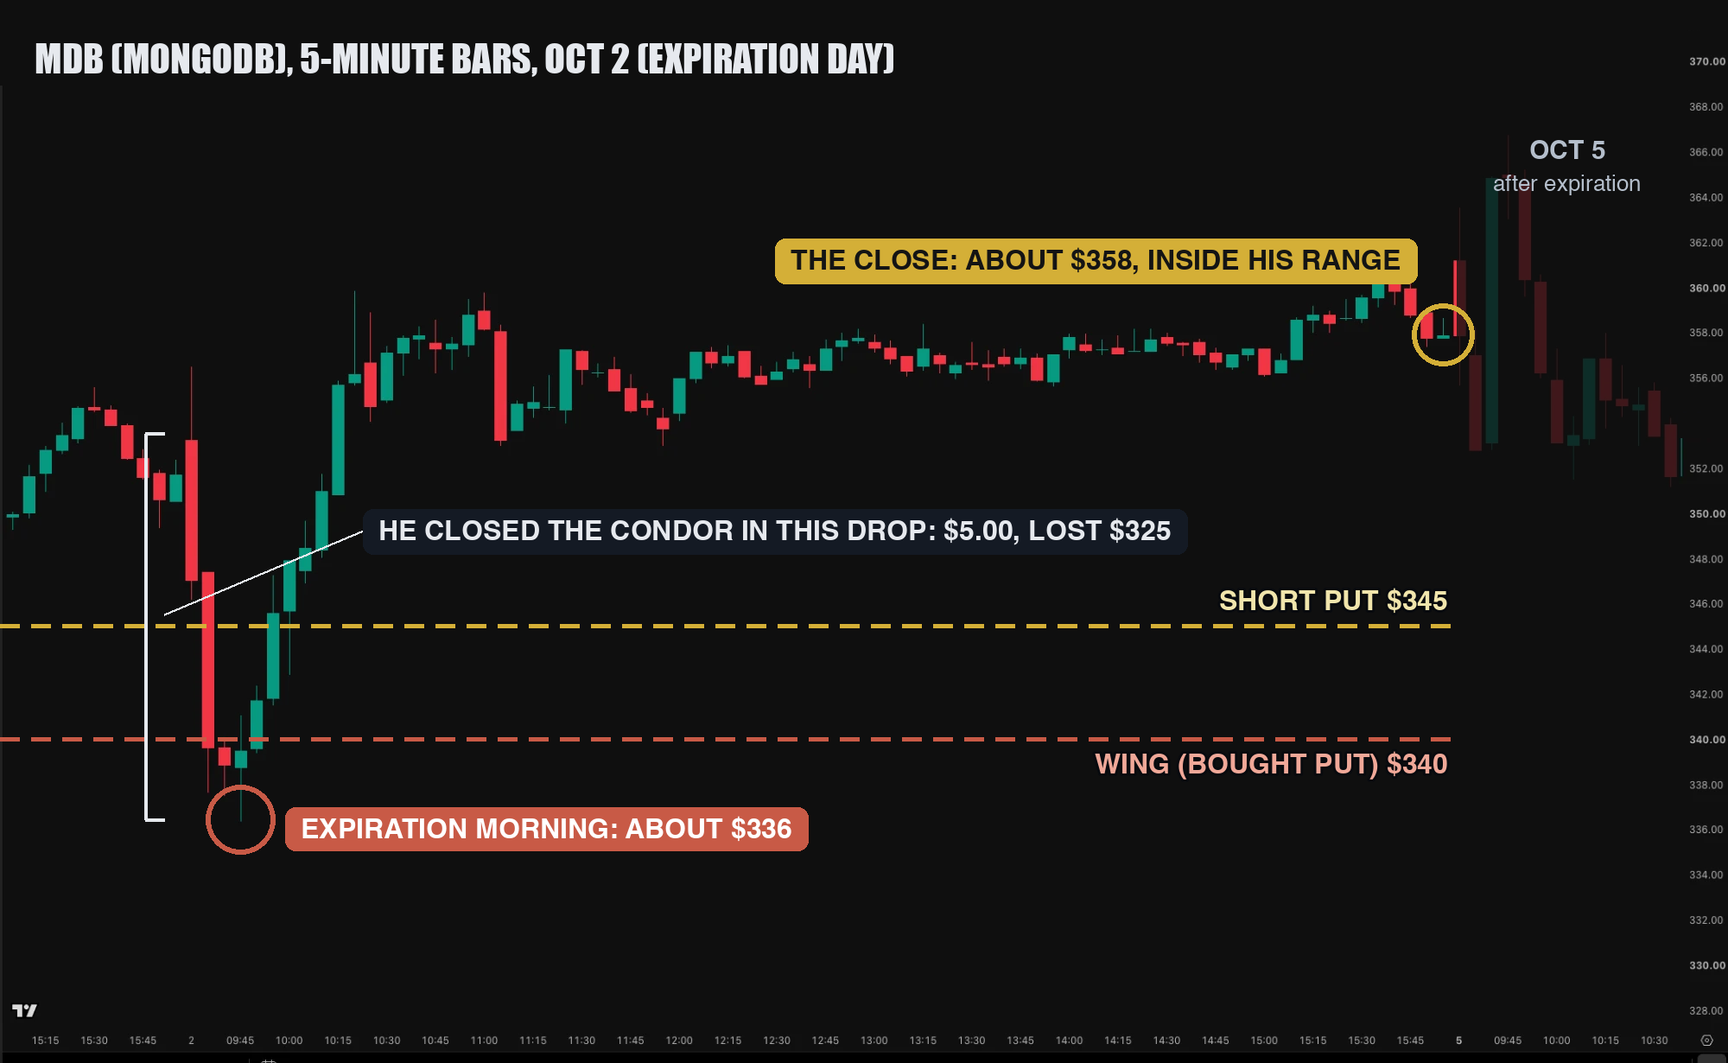
On Wednesday, September 2, he opened an iron condor on MDB (MongoDB). He sold the $345 put and the $450 call with wings $5 out, for expiration on Friday, October 2, and collected $1.75, or $175, with $325 at risk.
On expiration morning, MDB dropped below both of his puts, to about $336 on my chart, and he closed the whole condor during that drop. Closing cost $5.00 a share, or $500, so after the $175 collected the trade lost $325, the most it could lose. The wing he bought did its job and stopped the loss right there.
By the close, MDB was back near $358, inside his range. Held to the end, it would have expired worthless. Nobody knows that in the moment.
Here's the trade-off from earlier. He risked $325 to make $175, and one full loss like this one is bigger than either of the first two wins. That's why traders size it so the most they can lose is an amount they can afford.
How do traders pick an iron condor?
There are five choices. The underlying is the stock or index the options are on: SPX has no earnings reports and a stock does, so on a stock traders check whether an earnings report lands before expiration, since a report can move a stock past the short strikes overnight. Then the expiration: Uzi's three trades had 18 to 30 days to expiration, and shorter trades decay faster, while a big move near the end hits harder.
Then the short strikes: further apart means a smaller credit and more room for the stock to move, and closer together pays more and leaves less room. Then the wing width: wider wings collect a bit more and lose more when a side goes wrong. And the size: traders plan around the most they can lose, which was $325 on one contract of his MDB trade.
A quick check is the credit against the width. On his three trades it ran from about a quarter to a little over a third, and the bigger that share, the less you risk for each dollar you can make.
When do traders close an iron condor early?
Many close once most of the credit is in, like Uzi's second trade at about 70% of the credit, because the last part of the credit carries the most risk for what's left to gain. On that trade, holding for the last $105 kept a $655 loss possible.
Some close when a side is threatened, which caps the loss, or when a side has already gone through both strikes, like the MDB trade on expiration morning. Looking back, both of his early closes would have kept more if held to expiration this time, and that's only knowable afterwards.
Recap
The video and Uzi's trades
Uzi posts his trades to our members at Cash Flow University.
Educational content. Not financial advice. Options carry risk of loss. Selling options can lose more than the premium collected, and past results don't promise future ones.