How to Keep an Honest Record of Your Options Trades
By Stephen Manning · @StephenCFU on X · · 9 min read
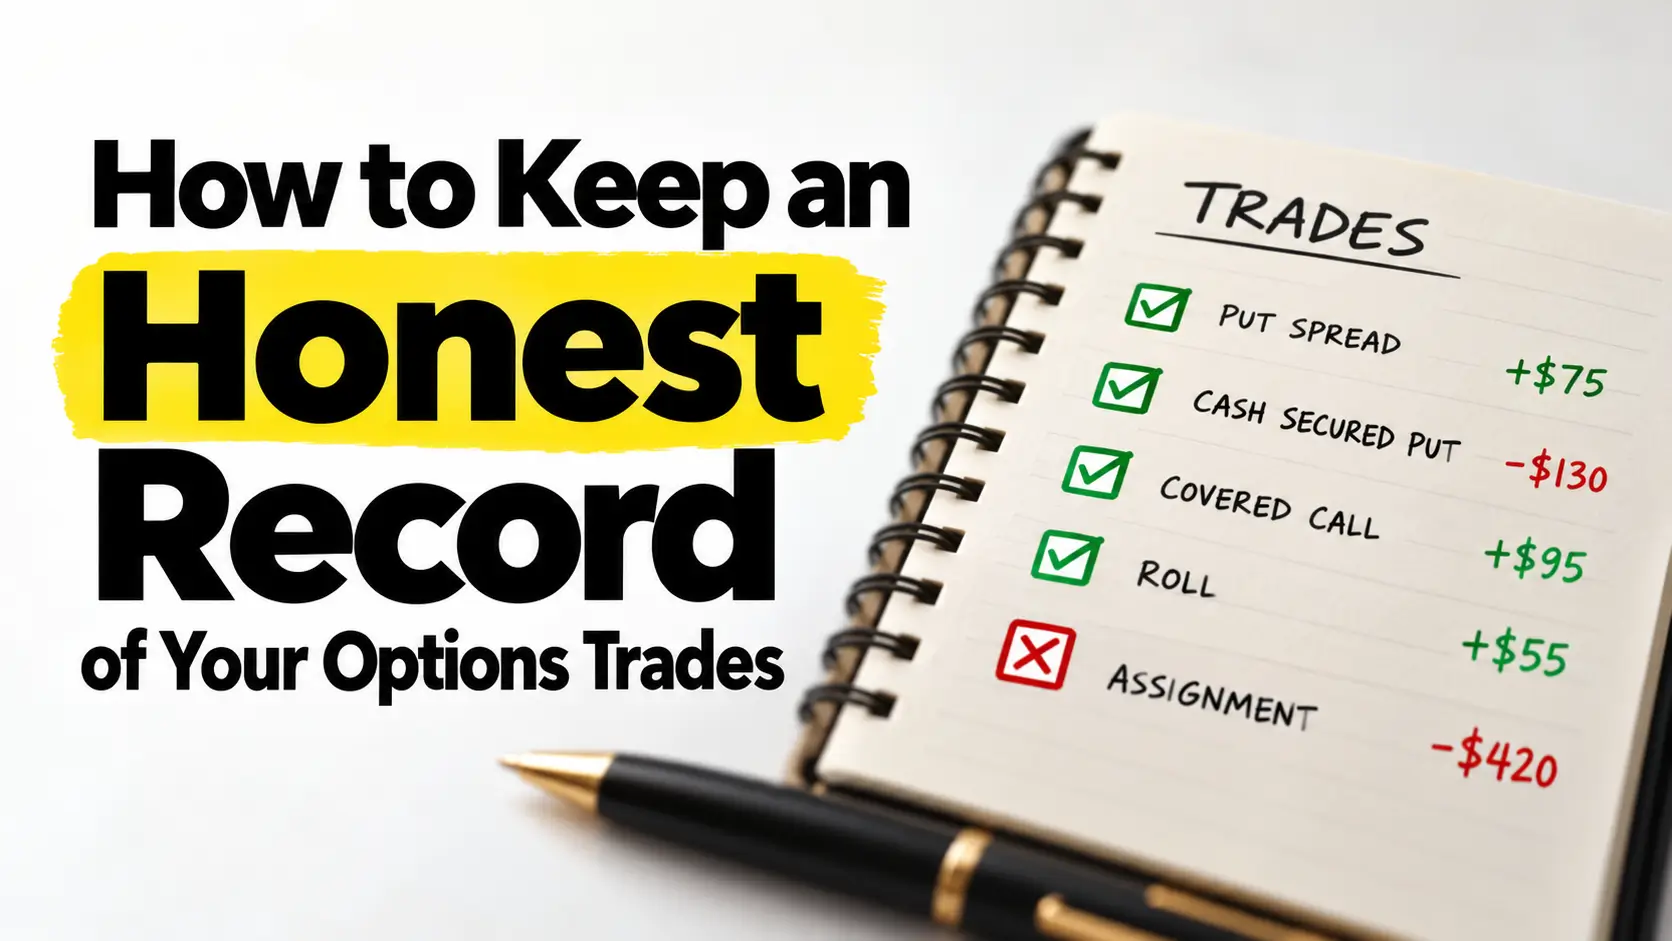
How to keep an honest record of your options trades, with worked examples of premium collected against income, rolls, assignments and trades closed in pieces.
An honest options record gives every trade one result: the sum of every leg and every fill in it, counted when the trade closes. Open premium, a roll credit booked too early and an assignment premium counted twice are the usual ways a record overstates what you made.
Your broker's confirmations have every fill. The record is where those fills get grouped into trades, and the grouping is where it goes wrong. Below are the places it bends, each with numbers you can redo on a calculator. Every example is made up except one, from our own record, and it is marked where it appears.
Is premium collected the same as income?
No. Premium collected is the cash that lands in your account when you sell an option. Income is what is left once the trades are closed, because buying an option back comes out of what you collected. A short option that is still open can still be bought back for more than you sold it for.
So count a trade when it closes, and keep the premium from open trades on its own line, where you can see it without counting it.
Here are four trades from a made-up month, one contract each.
Adding up what the four trades sold for gives $615. Adding up the trades that have closed gives $40: 75 minus 130 plus 95.
Trade D is $60 ahead on paper at today's price (1.80 sold, 1.20 to close). It can still end anywhere, so its $180 stays on its own line until it closes.
The options income tracker guide works through the same split.
How do you record a roll?
Link the old position and the new one into a single chain, write down what you paid to close the old one and what you got for the new one, and report one result when the last leg closes.
Your broker shows a roll as two fills, a buyback and a new sale, so the record has to join them. Treat each spread as its own trade and the counts come out wrong. Drop the buyback and the result does too.
Here is a made-up five-wide put credit spread, one contract, on a stock at 100. You sell the 95/90 spread, 45 days out, for 1.15. A month later the stock has fallen to 95.50 with 14 days left. You buy the spread back for 1.60 and sell the 93/88 spread, 49 days out, for 1.70, as one order, a net credit of 0.10. Later you buy the second spread back for 0.70.
Cash by leg is +$115, -$160, +$170 and -$70. The chain made $55.
Reading only the last spread gives $100, which leaves out the $45 the first spread lost. Booking the roll credit of 0.10 on the day you roll puts $10 on a trade that has a $45 loss behind it and a spread still open. Counted by trade, that is one winner. Counted by spread, it is one loser and one winner, so the win rate reads 50%.
Our performance page counts it the first way: a rolled position is one trade, start to finish, however many times it was rolled. How to track an options roll goes through a roll leg by leg, and The 88 shows what rolling looked like across our own put credit spreads.
How do you record an assignment?
Record two events. The option closes, and shares change hands at the strike. Then count the premium one of two ways, on the put or in the share cost, and use the same way every time.
Both ways give the same total once the shares are sold. Counting the premium in both places overstates the result.
Here is a made-up example. You sell one contract of the XYZ 52.50 put for 1.85 and it is assigned, so you buy 100 shares at 52.50. Later you sell the shares at 55.10.
Shares booked at the strike: (55.10 minus 52.50) times 100 is $260, and the put keeps its $185. Shares booked at the cost after premium (52.50 minus 1.85, or 50.65): (55.10 minus 50.65) times 100 is $445, and the put shows nothing. Both land on $445.
The third row books the premium twice and shows $185 that was only paid once. Your broker's tax figures can differ from your journal, and a tax professional can say which applies to you.
After each expiration, check your share count against your broker's. If your record says a put expired worthless and your broker shows 100 new shares, the put was assigned. Here is what happens when an option expires in the money. For the record itself, see how to record an options assignment.
What if a trade closes in pieces?
It is still one trade. Log each close against the same entry, add the pieces, and report one result.
Our performance page has a real one. It is a long LEAP call on BULL, four contracts, opened in May 2025. Three of the four contracts closed at +38% within days. The campaign ran 14 months, and the last contract was sold for a total loss of $420. Net for all four: +$60.
The last contract lost $420 and all four together made $60, so the first three made $480.
A sheet with a row for each contract shows three winners and a loser. The page counts the trade once, as a win, and says plainly that it was a poor use of capital for 14 months.
Which month does a trade belong to?
The month it closes. A trade opened in September and closed on October 2 is October income, and a trade still open on October 31 is not income yet.
Our performance page works this way: a trade counts in the month it closes, a rolled position is one trade, and positions still open count as zero. Grouping by close date keeps each month's closed results in one place.
What should an options trade record include?
The ticker, the strategy, every leg with its strike and expiry, the number of contracts, the fill for each leg, the net credit or debit, the most you can lose at entry, the dates opened and closed, how it ended and the result. Add one line on why you took the trade, written before you placed it.
Take each fill from your broker's confirmation. A price on the screen can differ from the price you got. Three habits keep the arithmetic straight:
- Prices are per share. Multiply by 100 and by the number of contracts, so a credit of 1.20 on two contracts is $240.
- Give credits and debits a sign and keep it. A buyback is a debit, and one entered as a credit flips the result.
- Say whether results are before or after fees, and keep to it.
What to track in an options trading journal has the full list and says why each field is there.
How do you check your record against your broker?
Once a month, add up the closed results in your record and compare them with your broker's realized figure for the same month. After any expiration, compare your share counts too. It is a short job.
When the two disagree, the usual causes are a missing fill, a wrong sign on a debit, a roll logged as two trades, an assignment that never made it into the record, and fees. Find the cause. Changing a number to make the totals match hides it.
A trade that rolls or closes in pieces across a month end will not tie to your broker month by month. Say the roll above is made in September and the last spread closes in October. Your broker realizes -$45 in September and +$100 in October, and your record shows +$55 in October. Only the total across both months agrees, so compare totals once the trade is done, and keep open chains on their own line.
Do you need an app, or is a spreadsheet enough?
A spreadsheet is enough for a few trades a month. It is flexible, and you can add any column you want. It gets harder when you roll, close in pieces or hold legs on different dates, because each event needs its own row and a formula that joins it to the rest of the trade.
Cash Flow University makes CFU Book for that case. It is a free options trade journal that keeps the legs of each trade together under one entry. It links a roll into one chain and shows the result across all its legs. Premium on open trades shows on its own line. It does not connect to a brokerage, so you log each trade yourself, and results are before fees. There is no card and no paid tier. If you want to load broker data, a spreadsheet may fit better, because CFU Book has no import.
To try the idea on your own numbers, take last month's closed trades and redo the total by trade. If it differs from your sheet's total, the gap usually traces to one of the places above.
The examples use made-up numbers, one contract each, before fees. The BULL figures are from our performance page as of October 16, 2026. Past results are not a prediction of future results. Options involve risk, and selling options can lose more than the premium collected. CFU Book is a record keeping tool. Nothing here is individual investment advice or tax advice. Trade your own account at your own size.