The Scanner That Hands You the Whole Trade
By Cash Flow University · · 3 min read
I show scanner output that delivers fully defined option trades—strikes, expiry, order and risk metrics—so you can choose and size, not assemble.
The PCS-100 scanner is free. Every CFU account has it, including free accounts. No card, no trial, no upgrade prompt, and nothing held back for paying members.
It scans for put credit spreads and gives you finished positions rather than tickers to go and research. Strikes, expiry, order type, the limit credit, and what you are risking. A recent run returned 44 of them.
Getting in
- Claim your free starter kit. That creates your account.
- Join the CFU Discord and sign in there. The members portal authenticates through Discord, so this step is not optional.
- Sign in at joincfu.com/members.
- Launch the PCS-100.
Step 2 is where people stop. About half our free members have never connected Discord, which is the only reason they have never seen this.
Reading one idea
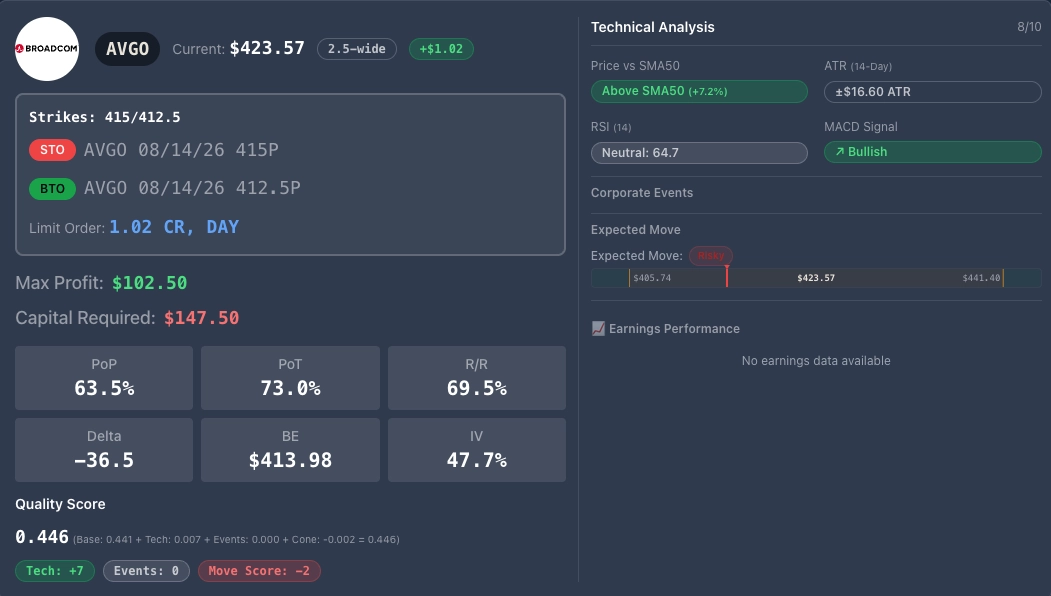
The left side is the trade. Sell to open the 415 put, buy to open the 412.5, as one limit order at 1.02 credit. You are risking $147.50 to make $102.50, with a break even of $413.98, which is 2.3% below where the stock trades.
The right side is context: price against the 50-day, the 14-day ATR, RSI, MACD, and the expected move through that expiry.
You could place that as printed. Nothing is left to work out.
Choosing between two
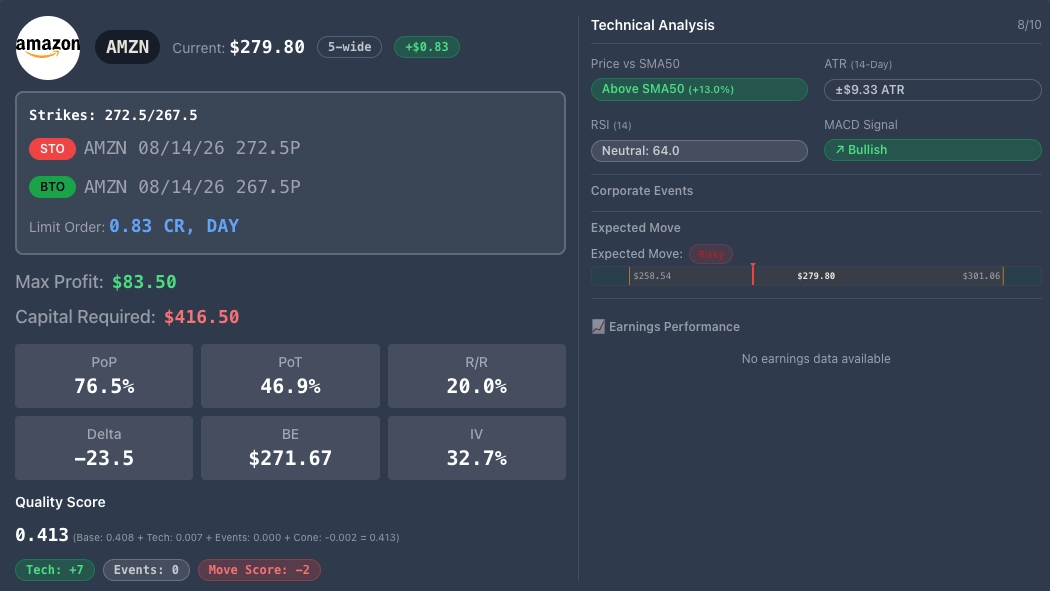
Same Friday, different trade, and this is the comparison worth learning.
Amazon looks safer on everything you would instinctively check. Probability of profit 76.5% against 63.5%. More cushion, with a break even 2.9% below the stock. Lower implied volatility.
It is also the weaker trade. $416.50 to make $83.50 is a 20% return on the money at risk. Broadcom's $147.50 to make $102.50 is 69.5%. Three Broadcom positions fit inside one Amazon, with change left over.
That is the decision this tool exists for. It prices the trade-off in front of you, rather than leaving you to assemble a position and discover afterwards what it cost you.
The quality score
Published as a sum, not a verdict.
AVGO   0.446 = Base 0.441 + Tech 0.007 + Events 0.000 + Cone -0.002
AMZN   0.413 = Base 0.408 + Tech 0.007 + Events 0.000 + Cone -0.002
Amazon ranks lower despite the better odds, because return on capital is in that formula and comfort is not. If you assumed it sorted by probability of profit, it is telling you plainly that it does not.
The cone term is negative on both. The expected move through that expiry was wide relative to the spreads, so the scanner marked down its own two best ideas. Sorting by quality sorts by what the tool actually thinks, penalties included.
What it will not do
It does not know what is in your account, what your sizing rules are, or what you can afford to be wrong about. Forty-four ideas came back in that run and most are wrong for any particular person.
It takes you from three thousand tickers to a few dozen defined positions. Choosing among them, and at what size, is still yours. Our published record is one contract per signal, closed trades only, and those figures only mean anything because the sizing decision was never ours to make.
If it breaks somewhere, reply and tell us where.
Past results, across all contracts. Not a prediction of future performance. Figures are per contract at one contract per trade, closed trades only, with open positions counted at zero. The AVGO and AMZN positions above illustrate the scanner's output and are not recommendations. Options carry risk including the total loss of premium paid. This is not individual investment advice and does not account for your circumstances.