Options Trading Statistics 2026: Traders, Volume and Losses
By Stephen Manning · @StephenCFU on X · · 14 min read
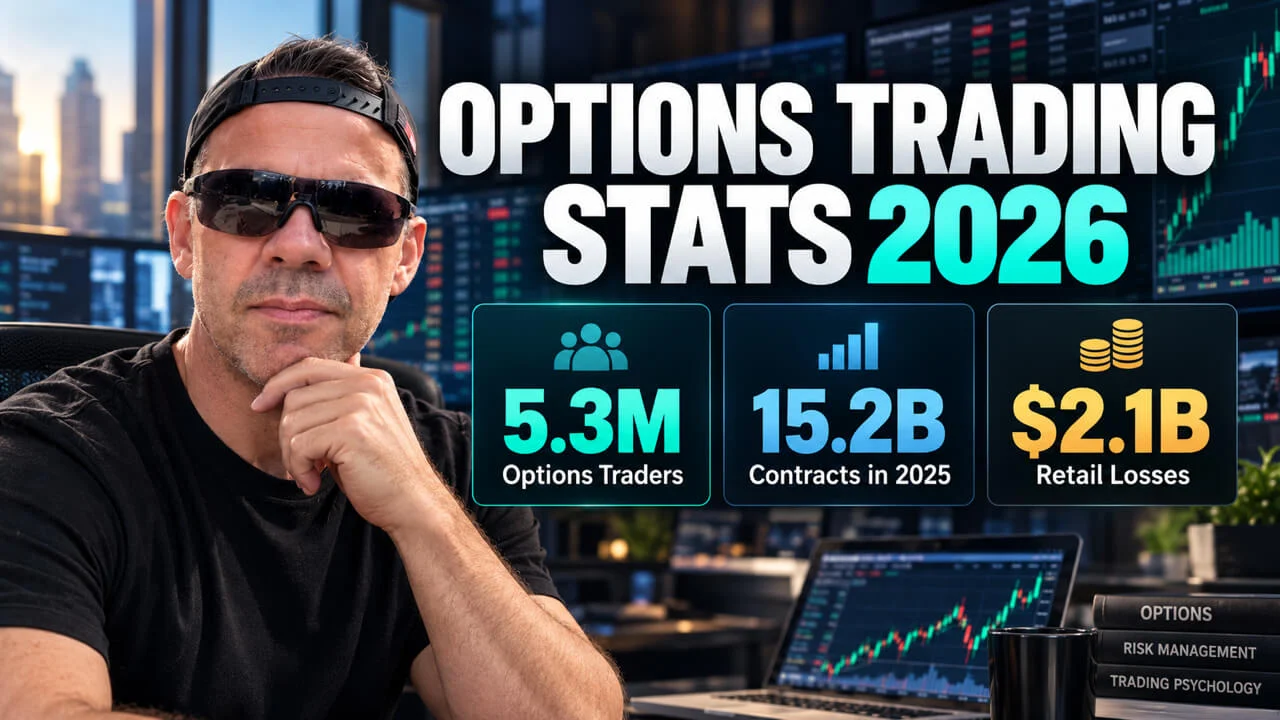
Options trading statistics, sourced and dated: how many Americans trade options, record volume, 0DTE, how many options expire worthless and who loses money.
About 5.3 million individual customers traded U.S.-listed options from November 2022 to the end of 2025, according to SEC staff analysis of Consolidated Audit Trail data published April 9, 2026. U.S.-listed options volume hit a record 15.21 billion contracts in 2025, up 24.4% from 2024, according to a January 5, 2026 report from the Options Clearing Corporation (OCC).
Below: who trades options, market size, 0DTE, expirations and retail results, each with its source, date and period. When a popular number has no source, I say so.
Updated October 3, 2026 by Stephen Manning.
Options Trading Statistics at a Glance
Key options trading statistics, October 2026
How Many People Trade Options?
About 5.3 million individual customers traded U.S.-listed options from November 2022 to the end of 2025, according to SEC staff (April 9, 2026). The exact count, 5,299,576, is 7.5% of the 70.6 million individual customers in the SEC's count, and 70.2 million of them traded stocks. Only about 227,000 of those customers traded options without also trading stocks, per the same SEC data.
The SEC counts CAT Customer IDs, the closest thing to a head count: one person with accounts at three brokers counts once, and a joint account can count twice. Its method also leaves out index options such as SPX.
In the FINRA Investor Education Foundation 2024 Investor Survey (published December 2025), 21% of U.S. investors with investments outside retirement accounts said they had ever bought or sold options, about the same as the 19% in 2021, and 43% said they have an account that allows options trading.
FINRA also found that 34% of U.S. adults hold investments outside retirement accounts, so roughly 7% of U.S. adults have ever traded options (0.21 x 0.34). That's our arithmetic. FINRA doesn't publish it.
Pages ranking for this question tend to cite a 2018 newsletter reader survey or a careers site's count of people employed as options traders. Neither counts the people who trade options for themselves.
Who Trades Options?
Younger investors are much more likely to have traded options. In the FINRA Foundation 2024 Investor Survey, 43% of investors under 35 had traded options, compared with 24% of those 35 to 54 and 10% of those 55 and older. In the same survey, men were more likely than women to have traded options (24% vs 17%) and to have an options-enabled account (48% vs 36%).
Fewer new people are starting. New individual customers entering options ran at 25,000 to 44,000 a month from mid-2022 through 2023, topped 50,000 in May 2024, then fell below 30,000 a month by late 2024 and kept declining through 2025, according to SEC staff. Volume kept setting records anyway, so my read is that people already in are trading more, and trading shorter.
How Big Is the Options Market in 2025 and 2026?
U.S. exchange-listed options volume set a record of 15.21 billion contracts in 2025, up 24.4% from 12.22 billion in 2024, according to the OCC (January 5, 2026). 2025 was the sixth record year in a row for U.S. listed options volume, according to Cboe (January 22, 2026). About 61 million contracts traded on an average day in 2025, and a record 110 million traded on October 10, 2025, per the same Cboe report.
Options volume grew about 3.7 times from 2016 to 2025, from 4.06 billion contracts to 15.21 billion (OCC data, summed by us):
Source: OCC Historical Volume Statistics, viewed October 3, 2026; futures excluded.
Through September 2026, an average of 70.6 million options contracts traded per day, 20.6% more than in the first nine months of 2025, according to the OCC (October 2, 2026). Those nine months cleared 13.2 billion contracts, already about 87% of the 2025 record (OCC data, our math). Average daily options volume hit 72.8 million contracts in Q2 2026, according to Cboe, which projected in July that 2026 is on pace for well above 18 billion contracts.
In 2025, single-stock options were 54% of U.S. options volume (8.27 billion contracts), ETF options 37% (5.68 billion) and index options 8% (1.26 billion), per the OCC (shares are our math). In Q2 2026, SPX accounted for 81% of index options volume and SPY for 42% of ETF options volume, and Nvidia and Tesla each made up 9% of single-stock options volume (Cboe). The 10 most-traded stocks made up 31.7% of single-stock options volume at the end of 2025, up from 24.0% in 2012 (SEC staff).
What Share of Options Trading Is Retail?
Retail traders account for roughly half or more of U.S. options volume, depending on who measures it and how.
- Retail brokers, 50% to 60%. Brokerages serving retail clients have carried between 50% and 60% of U.S. options volume since 2020, according to Cboe data cited in a Cboe-sponsored Forbes piece (September 2026). The underlying data is unpublished.
- Academic estimate, over 60%. Retail trading "recently reached over 60% of total market volume," according to a Journal of Finance study of November 2019 to June 2021 trades (December 2023). The paper doesn't give a date or method for that share.
- SEC staff, 54.3% and 73.5%. Individual investors were 54.3% of non-market-maker options volume on non-expiration days in December 2025 and 73.5% on expiration days, with index options excluded (SEC staff, April 2026).
They disagree because they count different things over different years: retail-broker order flow, an academic estimate from 2019 to 2021 data, and individual-customer accounts with market makers and index options left out.
How Popular Are 0DTE Options?
Zero-days-to-expiration (0DTE) options were 24.1% of all U.S. listed options volume in 2025, about 14 million contracts a day, up from 21.5% in 2024 and almost double the 2022 share, according to Traders Magazine citing OCC and Cboe data (February 2026). In the first half of 2026, 0DTE volume topped 20 million contracts a day, up 46.2% year to date (Cboe). SEC staff, in an analysis that leaves out index options, found the share of volume traded on expiration day rose from 19.6% at the start of 2022 to 28% by 2025.
In SPX, the S&P 500 index option, 0DTE is now most of the volume:
Retail traders made up an estimated 53% of SPX 0DTE volume in August 2025 (Cboe), and more than 75% of retail trades in S&P 500 index options were 0DTE, according to a working paper by Beckmeyer, Branger and Gayda covering most of 2022 and 2023.
Over 95% of SPX 0DTE trades were long options or spreads with a known maximum loss, and only 4% of SPX 0DTE trading was naked short options (Cboe, May 2025). A capped loss can still be the whole position in one day. More in our post on day trading options.
What Percentage of Options Expire Worthless?
About 22% of options expire worthless, according to the Options Industry Council (OIC), an investor-education group funded by the OCC. Its FAQ on options exercise says that historically more than 72% of options are closed out before expiration, about 22% expire worthless and about 6% are exercised. The page is undated, gives no period or method and calls them shares of "all option contracts" without saying whether that means contracts traded or contracts open at expiration, so treat it as a rule of thumb.
- "80% (or 90%) of options expire worthless": no primary source that we could find. The OIC figure is about 22%.
- "10% exercised, 55% to 60% closed, 30% to 35% expire worthless", credited to Cboe: we found it only on blogs and couldn't find it on any Cboe page.
Expiring worthless doesn't tell you who made money. Most positions close before expiration, and a seller can buy back a short option at a loss days before it would have expired worthless. The mechanics are in what happens when an option expires in or out of the money.
Do Most Options Traders Lose Money?
On average, retail options traders lost money in each U.S. study we found, and trading costs were a big part of it. We found no U.S. regulator that publishes the share of options traders who lose, and the popular "90% of options traders lose money" line has no primary or peer-reviewed source we could find.
Don't add these up. The $2.1 billion assumes a 10-day holding period, the $3 billion is scaled up from a sample covering about a quarter of option activity, and the working papers weren't peer reviewed at these versions.
Retail investors favored cheap weekly options with an average bid-ask spread of 12.6% from November 2019 to June 2021, according to the Journal of Finance study. Market-wide, the median effective spread at the end of 2025 was 1.9% of the trade price on single-stock options and 1.4% on ETF options (SEC staff).
In December 2025, individual customers' marketable single-leg options orders executed electronically got price improvement 0% to 13% of the time, depending on spread width, while their non-marketable limit orders executed electronically got it 80% to 99% of the time (SEC staff). My take: use limit orders, and be careful with wide spreads on cheap weeklies.
Do Option Sellers Do Better Than Option Buyers?
In the trader-level research we found, selling did better on average. In data on 5,182 retail traders from 2020 to 2022, naked option sales (13% of option trades) earned 20% on average, while option purchases lost 3.95% and the average option trade returned -0.9% (Bogousslavsky and Muravyev, August 2024). Those traders used a trading-journal service, and the authors call them relatively sophisticated. In 0DTE, retail losses came mainly from single-leg, premium-paying and high-implied-volatility trades, and multi-leg trades were significantly more profitable, though they also lost money on average (Beckmeyer, Branger and Gayda).
The catch: selling premium tends to win often and give back a lot when it loses, so look at the win rate next to the average win and the average loss. Our post on probability of profit shows why a high POP comes with a bigger loss when the trade goes wrong.
What Does One Audited Trade Record Look Like?
This is our own record, so weigh it accordingly. Market data can't show one record's win rate next to its average loss, so here's ours as a worked example.
From 1 July 2025 to 28 July 2026, Cash Flow University closed 760 trades: 706 won and 54 lost, a 92.9% win rate. The average win was $148 and the average loss was $519, per contract at one contract per trade, so the average loss was about 3.5 times the average win. The profit factor was 3.73, meaning total dollars won were 3.73 times total dollars lost.
Read alone, 92.9% would mislead you. It took about three and a half average wins to cover one average loss, the same trade-off the premium-selling research points to.
A rolled trade counts once, in the month it finally closes, so a roll can't turn one position into several wins. A position still open isn't in the count until it closes. Most trades in the last 12 months sold premium. Of the 700 trades opened from 3 October 2025 to 2 October 2026, put credit spreads were 25%, covered calls 14%, cash-secured puts 13%, call credit spreads 11%, LEAP calls 10%, strangles 6%, iron condors 5%, long calls 3% and other structures 13%.
CSH Analytics, an independent firm we engaged to audit the record, has audited it monthly and annually since April 2023, across 1,200+ closed trades with the losses included. Anyone can read the audit report (PDF) and the latest results on our performance page, and members see every trade.
How Well Do Options Traders Understand Options?
Not that well, going by one question. Only 12% of U.S. investors answered a basic call-option question correctly in the FINRA Foundation 2024 Investor Survey (published December 2025), and half said they didn't know. It asked what a call with a $50 strike is worth on its expiration day with the stock at $40 (the answer is $0). Among investors who have traded options, 22% got it right and 54% got it wrong.
How to Check an Options Statistic Before You Repeat It
Most shaky numbers on this topic fail one of these checks:
- Who measured it? A regulator, an exchange, a journal and a blog are different grades of evidence.
- What period? A 2021 figure describes the meme-stock peak. An undated one could be from any year.
- What does it count? People, accounts, contracts or dollars?
- A share of what? All contracts, contracts held to expiration and volume excluding market makers are different denominators.
- Who paid for it? Exchange-sponsored content can be accurate. Say who sponsored it when you quote it.
Options Trading Statistics FAQ
What percentage of options traders are profitable?
We found no U.S. regulator that reports the share of options traders who are profitable, and no primary source for the "80% to 90% lose" figures on many sites. Retail options traders lost money on average in each U.S. study cited on this page.
How many options contracts trade per day?
About 61 million a day in 2025 and 70.6 million a day through September 2026, according to the OCC. The record was 110 million on October 10, 2025 (Cboe).
Are options more popular than stocks?
Far more people trade stocks: about 5.3 million individual customers traded options from November 2022 to the end of 2025, against 70.2 million who traded stocks (SEC staff). Options volume set its sixth straight record in 2025 (Cboe).
What is the most traded option?
SPX, the S&P 500 index option, was 81% of index options volume in Q2 2026, and SPY was 42% of ETF options volume (Cboe). Nvidia and Tesla led single stocks at 9% each, then Apple at 3%.
Do 90% of options expire worthless?
We found no primary source for the claim that 90% of options expire worthless. The OIC puts the share of options that expire worthless at about 22%, historically (OIC FAQ, undated).
Sources and Methodology
Figures gathered October 3, 2026; next update after Cboe's Q3 2026 report. Where we did the math, the text says so. Cboe puts 2025 growth at 26% and the OCC at 24.4%, so each figure is credited to its own source. The retail shares, the 2026 pace, the OIC split and the academic loss figures are estimates.
- OCC: 2025 volume (Jan 5, 2026), September 2026 volume (Oct 2, 2026), historical statistics (viewed Oct 3, 2026).
- Cboe: State of the Options Industry 2025 (Jan 22, 2026) and Q2 2026 (Jul 21, 2026); 0DTE posts of Sep 8, 2023, May 2, 2025 and Sep 2, 2025; volume releases of Jan 6, 2025, Jan 6, 2026 and Aug 5, 2026.
- SEC Division of Trading and Markets staff, Roundtable on Options Market Structure: Supporting Data (Apr 9, 2026).
- FINRA Investor Education Foundation, Investors in the United States (Dec 2025).
- Options Industry Council, Options Exercise FAQ (undated).
- Research: Bryzgalova, Pavlova and Sikorskaya (Journal of Finance, Dec 2023); de Silva, So and Smith (Review of Finance, 2026); working papers by Beckmeyer, Branger and Gayda (Dec 2023) and Bogousslavsky and Muravyev (Aug 2024).
- Trade press: Traders Magazine (Feb 19, 2026); Forbes, Cboe BrandVoice, a paid program (Sep 18, 2026).
New to options? Start with our free starter kit.