Election Volatility: Why Stocks Underperform Before Midterms and Rally After
By Cash Flow University · · 6 min read
Discover why stock markets dip before midterms and surge after, exploring election volatility's impact on investments.
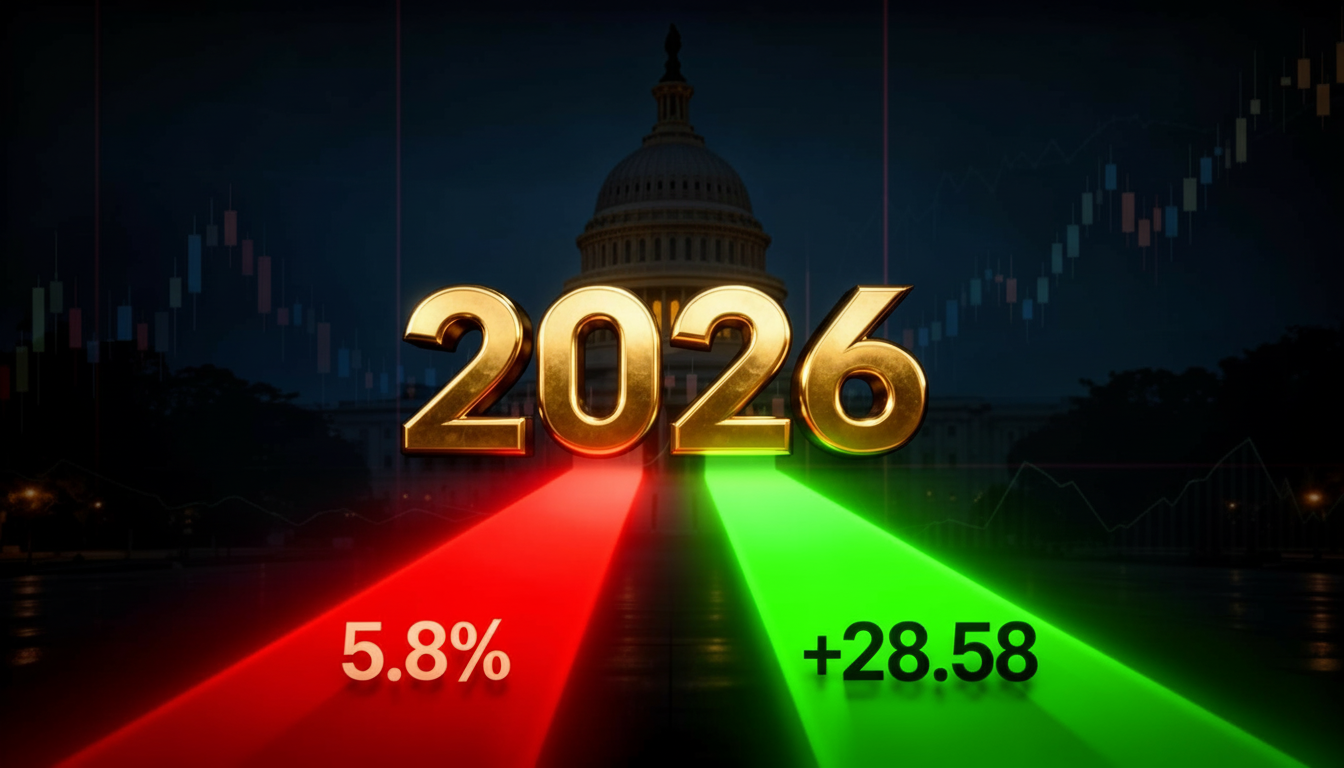
2026 could disappoint with average +5.8% returns—or deliver a stunning +28% rally. Only one year in history shares our current setup: 1998. Here's why that matters for your portfolio.
📊 Key Takeaways
- ✓ 100% Win Rate: Post-midterm 12-month returns have been positive every time since 1950
- ✓ Midterm years average just +5.8%—worst of the four-year cycle
- ✓ 2026 shares rare setup with 1998 (which rallied +28.58%)
- ✓ Classic pattern: H1 weakness → summer bottom → Q4 rally
- ✓ Options premium selling peaks during midterm volatility
In This Article:
Since 1928, the S&P 500 has returned an average of just 5.8% during midterm election years—the weakest performance in the four-year presidential cycle. But averages don't tell the whole story. Some midterm years have delivered crushing losses, while others have produced exceptional gains.
The key isn't just knowing it's a midterm year—it's understanding which type of midterm year you're in. And 2026 has a very specific historical parallel that could change everything.
The Presidential Cycle Effect
The presidential cycle is one of the most reliable patterns in market history. Yale Hirsch first documented it in the 1960s, and it has continued to hold true for nearly a century.
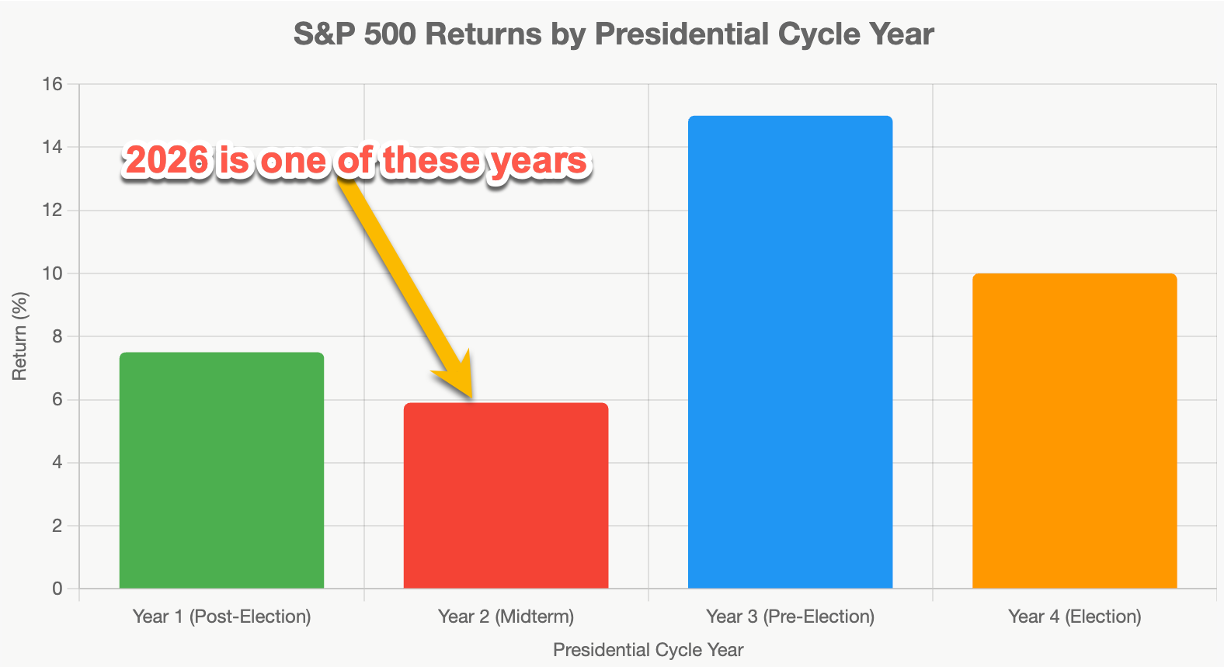
S&P 500 average annual returns by presidential cycle year (1928-2024)
The pattern makes sense when you consider political incentives. Presidents push painful policies early in their terms and stimulative measures before elections. The first two years often bring uncertainty and policy battles, while years three and four focus on economic "feel good" initiatives.
Why 2026 is Different: The 3-Year Streak Factor
Here's where 2026 gets interesting. We're not just entering any midterm year—we're entering a midterm year after three consecutive years of double-digit gains. This is exceptionally rare.
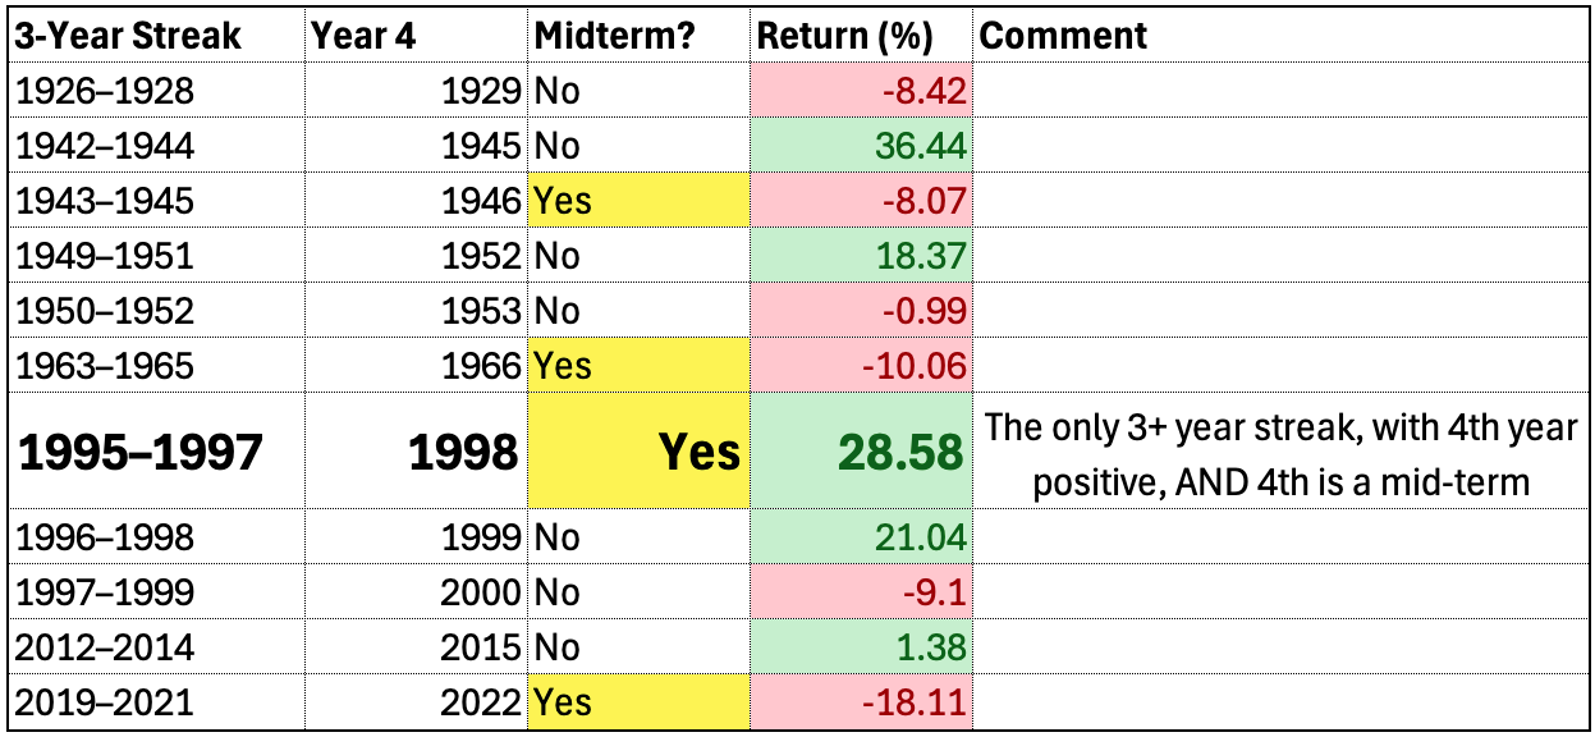
Midterm years following 3+ consecutive positive years (1928-2024)
Looking at the data, only two midterm years in history have followed three consecutive years of gains: 1998 and 2022. The outcomes couldn't have been more different:
| Factor | 1998 | 2022 | 2026 |
|---|---|---|---|
| Fed Policy | Cutting rates | Hiking aggressively | Pause/Cutting? |
| Inflation | Low (1.6%) | High (9.1% peak) | Moderating |
| Tech Sector | Dot-com boom | Post-bubble bust | AI boom |
| Valuations | Elevated | Elevated | Elevated |
| Result | +28.58% | -18.11% | ? |
The question for 2026: Are we facing a 1998-style continuation rally, or a 2022-style mean reversion? The answer likely depends on Fed policy and whether the AI-driven tech rally can sustain momentum.
Two Scenarios for 2026
Given the historical parallels, traders should prepare for two distinct possibilities. Understanding both scenarios helps you position appropriately regardless of which unfolds.
🐂 Scenario A: The 1998 Repeat
If 2026 mirrors 1998, expect the rally to continue with only brief pullbacks. The AI boom extends, Fed remains accommodative, and momentum begets momentum.
- → Fed cuts rates or pauses
- → AI productivity gains materialize
- → Corporate earnings accelerate
- → Global liquidity expands
🐻 Scenario B: The 2022 Echo
If 2026 rhymes with 2022, the extended bull run finally exhausts. Mean reversion kicks in, and elevated valuations compress as growth disappoints.
- → Inflation re-accelerates
- → Fed forced to hike again
- → AI hype exceeds reality
- → Credit conditions tighten
⚠️ The 2022 Warning
Remember: 2022 also followed three strong years and still delivered -18.11%. Extended winning streaks can end abruptly. The difference between 1998 and 2022 was primarily Fed policy direction. Watch the Fed closely in 2026.
The Midterm Year Timeline: When to Expect Volatility
Now that we understand the possible outcomes, let's examine when the key moves typically happen. Midterm years follow a remarkably consistent seasonal pattern:
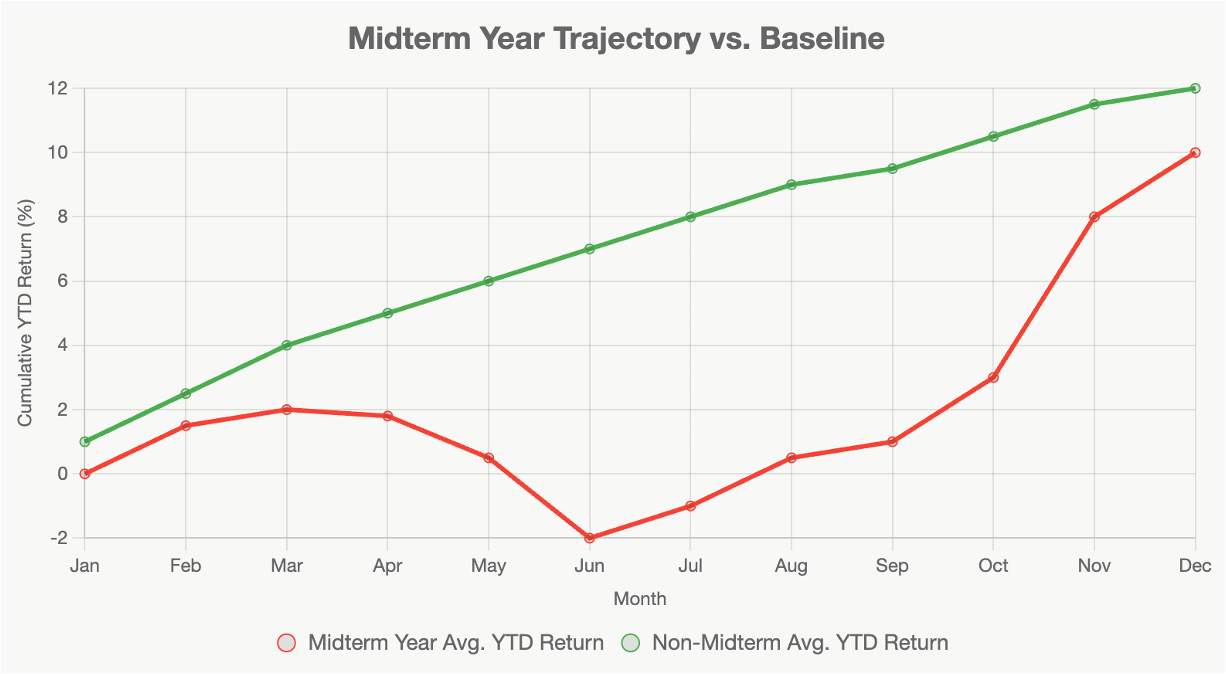
Typical S&P 500 trajectory during midterm election years
Volatility emerges as policy uncertainty peaks. Average midterm Q1 return: -1.2%
Continued weakness. "Sell in May" effect amplified during midterms. Watch for June lows.
Summer bottom forms. The ideal accumulation window. Historical low often occurs July-October.
Post-election clarity sparks rally. Average midterm Q4 return: +7.3%. The sweet spot begins.
Since 1950, the S&P 500 has been positive 100% of the time in the 12 months following midterm elections. The average gain: +15.1%.
Trading Strategies for Midterm Volatility
Now that we understand the possible outcomes and their timing, let's build a game plan. Midterm volatility creates specific opportunities for options traders:
1. Premium Selling in High-IV Environment
Elevated uncertainty = elevated implied volatility = fatter premiums. Credit spreads and iron condors become more attractive when VIX spikes during H1 weakness. Target 30-45 DTE positions during volatility spikes.
2. Accumulate During Summer Weakness
The July-October window historically offers the best entry points. Consider scaling into long positions via cash-secured puts—collect premium while waiting for lower prices, or get assigned at attractive levels.
3. Position for the Q4 Rally
By late September, consider shifting from premium selling to directional long exposure. Calendar spreads or LEAPS can capture the post-election rally with defined risk. The 100% post-midterm win rate is your tailwind.
4. Manage the 2022 Risk
Keep position sizes moderate until Fed direction is clear. Use defined-risk strategies. If inflation re-accelerates or the Fed turns hawkish, be ready to shift defensive. The 2022 scenario is the minority outcome—but it's not zero.
📋 Quick Summary
- 1 The Setup: 2026 is a midterm year following 3 consecutive gains—only 1998 (+28.58%) and 2022 (-18.11%) share this profile.
- 2 The Pattern: Expect H1 weakness, a summer bottom, and a Q4 rally. Post-midterm 12-month returns have been positive 100% of the time since 1950.
- 3 The Strategy: Sell premium during H1 volatility, accumulate in summer, position long for Q4. Watch the Fed for 1998 vs 2022 signals.
The Bottom Line
2026 presents a fascinating setup for traders who understand market history. The presidential cycle suggests caution—midterm years are historically weak. But the rare 3-year winning streak precedent creates asymmetric possibilities.
The smart approach: Prepare for volatility in H1, look for accumulation opportunities during summer weakness, and position for the historically reliable post-midterm rally. Whether 2026 delivers 1998-style gains or 2022-style pain, the trader who understands the seasonality will be ready.
One thing is nearly certain: the 12 months following November 2026 should be very good for stocks. That 100% win rate since 1950 is the light at the end of whatever tunnel 2026 throws at us.
Frequently Asked Questions
Why do midterm election years underperform?
Midterm years often see policy uncertainty peak as the president's party typically loses congressional seats. This political gridlock creates market hesitation. Additionally, stimulus measures are often pushed to years 3 and 4 to benefit re-election campaigns.
Is the post-midterm rally guaranteed?
No pattern is guaranteed. However, the S&P 500 has been positive in the 12 months following every midterm election since 1950—a 100% success rate over 18 cycles. Past performance doesn't guarantee future results, but this is one of the most reliable patterns in market history.
Should I sell everything before a midterm year?
Not necessarily. While midterm years average weaker returns, timing the market perfectly is extremely difficult. A better approach is to stay invested but adjust your strategy—perhaps reduce risk in H1 and increase exposure during summer weakness to catch the Q4 rally.
What makes 2026 different from typical midterm years?
2026 follows three consecutive years of strong gains (2023, 2024, 2025). This is extremely rare—only 1998 and 2022 share this setup. 1998 saw the market continue higher (+28.58%), while 2022 saw mean reversion (-18.11%). The outcome likely depends on Fed policy and whether the AI rally can continue.
Master Market Cycles
Learn how to trade every phase of the presidential cycle with our comprehensive options strategies guide.
Get the Free Ebook →