How to Read a Stock Chart for Options Trading: The 6 Levels That Actually Matter
By Cash Flow University · · 7 min read
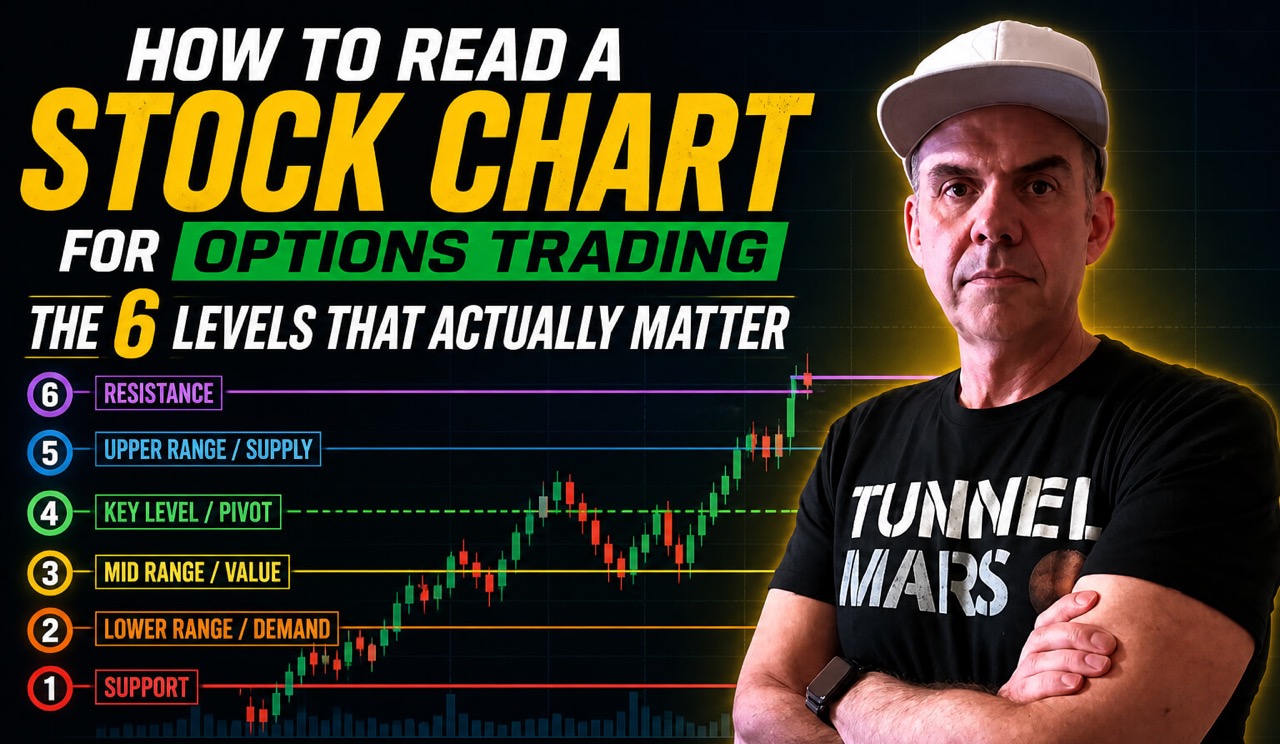
The 6 chart levels I use to structure high‑probability options trades—trend, zones, MAs, volume, IV vs HV, and the implied move filter.
How to Read a Stock Chart for Options Trading: The 6 Levels That Actually Matter
Table of Contents
- Why Chart Reading Is the Wrong Starting Point for Most Traders
- The "Quick Cash" Trap and What It Actually Costs You
- Level 1: The Trend Direction (Your Trade Bias)
- Level 2: Support and Resistance Zones
- Level 3: The 50 and 200 Moving Averages
- Level 4: Volume Confirmation
- Level 5: Implied Volatility Relative to Historical Volatility
- Level 6: The Options-Specific Level Most Traders Ignore
- How to Apply All 6 Levels Before You Enter a Single Trade
- FAQs
- Start Seeing Charts Differently
Most people searching for quick cash find options within minutes. Here is the truth. Professional traders do not chase speed. They read charts with precision. They build trades around very specific levels.
Charts don't predict. They locate. My edge is knowing which levels matter for the option I sell or buy.
Why Chart Reading Is the Wrong Starting Point for Most Traders
Most retail traders learn charts backwards. They memorize patterns like head and shoulders or flags. Then they try to force those patterns onto trades. I do not operate that way.
A chart is a map of where price has been and where it might stall, reverse, or accelerate. I find the 6 levels that change strike selection and sizing. Miss these and you are just guessing.
The "Quick Cash" Trap and What It Actually Costs You
Buying short dated calls or puts looks fast. It is also where theta kills traders. If you buy a weekly call, you fight time every day. I prefer to sell premium with defined risk. I use put credit spreads, covered calls, and call credit spreads.
The playbook is not about lottery tickets. It is structure. Sell where the chart gives you buffers. Define risk. Let theta and math work for you.
Level 1: The Trend Direction (Your Trade Bias)
First, I label the regime. It is either an uptrend, a downtrend, or a range. This picks the strategy.
- Uptrend: I sell bullish premium. I use cash-secured puts, put credit spreads, and covered calls.
- Downtrend: I lean bearish. I use call credit spreads or long puts if IV is cheap.
- Range: I sell iron condors and neutral credit spreads.
Use the simple test. Higher highs and higher lows on the daily chart mean an uptrend. Lower highs and lower lows mean a downtrend. Everything else is a range. Do not sell a put credit spread in a confirmed downtrend.
Level 2: Support and Resistance Zones
Support is where buyers step in. Resistance is where sellers cap moves. These are strike selection guides.
- When I sell a put credit spread, my short strike goes at or below a support zone.
- I look for levels with 2–3+ bounces. One touch is noise. Multiple touches make a zone.
That zone is my buffer. The stock must cut through a floor before I lose money.
Level 3: The 50 and 200 Moving Averages
Institutions watch the 50-day and 200-day moving averages. Big money respects them. I follow their lead.
- Above 200-day: Long term uptrend. I sell bullish premium.
- Below 200-day: Long term downtrend. I am cautious with bullish premium.
- 50 > 200 (golden cross): Momentum is high.
- 50 < 200 (death cross): Trend is weak.
In uptrends, a pullback to the 50-day is a high odds entry for a put credit spread. The moving average acts as a floor.
Level 4: Volume Confirmation
Price without volume is fake. Volume shows commitment.
- High volume on an up day: Buyers are in control.
- High volume on a down day: Sellers are in control.
- Breakouts on ~3× average daily volume usually continue.
I check for real participation on every push. A good pattern on low volume is a trap.
Level 5: Implied Volatility Relative to Historical Volatility
This is where options differ from stocks. Implied volatility (IV) is the price of future moves. Historical volatility (HV) is how much the stock actually moved.
When IV is higher than HV, options are expensive. I sell them. When IV is low compared to HV, options are cheap. I buy them or use narrow spreads.
Use these shortcuts:
- IV Rank (IVR) > 50: Premium is high. Selling strategies win.
- IVR < 20: Premium is cheap. Buying call or puts can work.
Level 6: The Options-Specific Level Most Traders Ignore
The implied move is the market expectation for price change by expiration.
Calculate it with the at-the-money straddle price.
Here is my filter. Support and resistance must be outside that implied move. If the move is 6% and support is only 3% away, the market expects a breakout. That support will fail.
I only place a credit spread if my short strike stays outside the implied move. I want to get paid for the risk.
How to Apply All 6 Levels Before You Enter a Single Trade
Use this checklist for every setup:
- Trend direction: Up, down, or range?
- Support and resistance: Where are the real floors and ceilings?
- Moving averages: Is price above or below the 50 and 200?
- Volume: Is the move confirmed by high volume?
- IV vs. HV: Is IVR high for selling or low for buying?
- Implied move filter: Is my short strike outside the expected range?
When everything aligns, I trade with confidence. If 2 items are off, I pass. I may also cut the position size.
Check the boxes before entry to better your odds. Nothing is guaranteed. A structured process beats emotion every time.
I show how I apply these levels to live trades at joincfu.com. Read the CFU blog for strategy deep dives. Grab the free Starter Kit before your first trade.
FAQs
What is the most important chart level for options trading?
IV relative to HV matters most. It tells me to buy or sell premium. That choice is everything.
How do I find support and resistance levels on a stock chart?
I mark levels where price reversed 2–3 times. Single hits are weak. Draw horizontal lines at those zones.
What is the implied move and how do I calculate it?
Add the ATM call and ATM put price. That sum is the expected move. Keep short strikes outside that range.
Should I use the 50-day or 200-day moving average?
Use both. The 200-day shows the trend. The 50-day shows near term support. Pullbacks to the 50-day in an uptrend are great for selling puts.
Can I earn consistent cash from options without predicting direction?
Yes. Credit spreads profit if the stock stays in a range or moves your way. You just need a wide buffer.
What is theta decay and why does it matter for "quick cash" strategies?
Theta is the loss of time value. Buyers lose it. Sellers collect it. Position as a seller to let time work for you.
How many levels should align before I enter?
Try for 6. Usually 5/6 works if the miss is small. If fewer than 4 align, just pass.
Start Seeing Charts Differently
Stop treating charts like a crystal ball. Treat them like a map. Trend, zones, moving averages, volume, and IV are your checklist. Use the implied move filter to find high probability trades.