Implied Volatility 2026: The One Number That Matters
By Cash Flow University · · 7 min read
Implied volatility drives your option pricing and your P&L—learn how to read it, avoid IV crush, and sell premium with defined risk for consistent cash flow.
Last updated: May 9, 2026
I have coached thousands of traders. The same mistake shows up over and over. Traders buy options before a big event. They fail to check implied volatility. Learn this pricing input. Make it your focus. It is the difference between a correct guess that loses money and a process that pays you.
Table of Contents
- Why "Make Money Fast" Usually Ends in a Fast Loss
- What Implied Volatility Actually Is
- The IV Crush Problem: A Case Study
- The Volatility Edge: Selling High IV, Not Chasing It
- Advanced Concept: IV Skew & How It Affects Your Spreads
- How to Read IV Before You Enter Any Trade
- The IV Percentile Rule: Your Go/No-Go Filter
- Putting It Together: A Realistic Path to Consistent Cash Flow
- Frequently Asked Questions
Why "Make Money Fast" Usually Ends in a Fast Loss
Buying options before an event loses money. Volatility crush is the reason. The temptation is strong. You see an earnings date. You think a stock will pop. You buy a $1.50 call. The stock moves as you expected. You log in to celebrate.
Instead the option is worth $0.90. Direction right. P&L wrong.
IV crush causes this pain. This is a fast drop in price. It happens when implied volatility falls. It kills your premium even when the stock moves your way. Master IV to stop this mistake.
What Implied Volatility Actually Is
Implied volatility (IV) is the market expectation of price movement. It is an annualized percentage. Market prices set the number. It does not come from past movement.
Think of it as the price of uncertainty. Uncertainty is high before earnings. Buyers pay more for options. This demand inflates the price. High IV follows. A $100 stock with IV at 40% implies a move of $40 over one year. This move can be up or down.
"At Cash Flow University, we teach one principle. IV is the market fear gauge. Our edge comes from selling insurance to the fearful. We do not buy it at high prices."
Uncertainty ends when the event passes. IV drops to its baseline. This is mean reversion. Rapid price drops catch traders off guard.
The IV Crush Problem: A Case Study
IV crush happens when volatility drops fast. It kills more value than the stock move adds. Look at this earnings trade.
The Setup: An Earnings Gamble
- Stock: TECH Corp ($TECH) trades at $100.
- Catalyst: Earnings arrive after the close tomorrow.
- Volatility: Pre-earnings IV spikes to 120%.
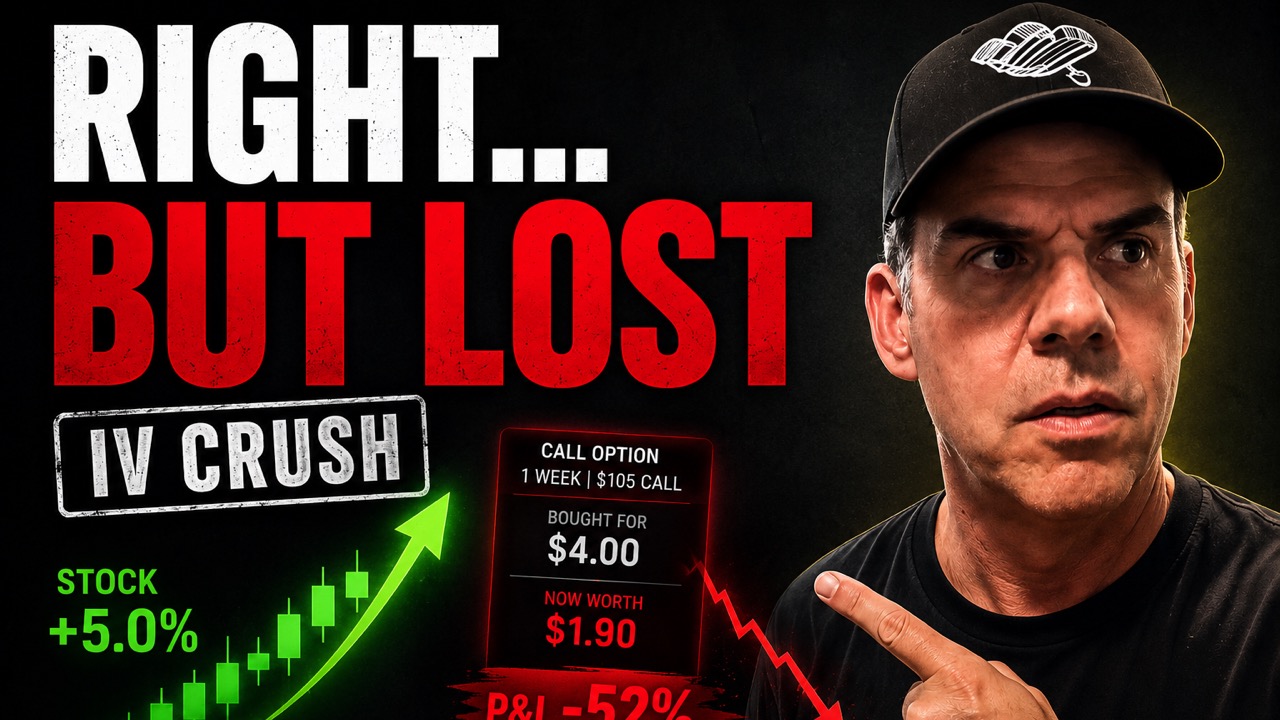
- The Trade: A trader buys a 1-week, $105-strike call for $4.00.
The Result: Directionally Right, Financially Wrong
- The News: TECH Corp reports great earnings. The stock moves to $105. The trader got the direction right.
- The Crush: Uncertainty is gone. IV drops from 120% to 35%.
- The P&L: The call is now at-the-money. The stock move helped. The IV crush destroyed the value. The call is worth about $1.90.
The stock jumped 5%. The trader lost over 50% of his capital. (($1.90 - $4.00) / $4.00). This is the IV crush trap.
The Volatility Edge: Selling High IV, Not Chasing It
Primary edge comes from selling rich premium. You sell when IV is high. You do not buy it. Options decay. Research from the CBOE shows most options expire worthless. The seller keeps the cash. High IV makes time decay (theta) faster. It increases the credit. This gives you room for error.
We use defined-risk strategies:
- Put Credit Spreads: We sell a high-strike put and buy a low-strike put. High IV means more credit for the same risk. We win if the stock stays above our short strike.
- Cash-Secured Puts: We sell puts on stocks we want to own. High IV pays big while we wait.
- Covered Calls: We sell calls against shares we own. High IV creates more income. It lowers our cost basis.
- Iron Condors: We sell a put spread and a call spread. This gains from high IV. We profit if the stock stays in a range.
These strategies stack the odds. We do not bet on direction. We bet that expensive assets will lose value as fear fades.
Advanced Concept: IV Skew & How It Affects Your Spreads
IV Skew is a market fact. Out-of-the-money puts have higher IV than calls. This is the volatility smirk. Traders fear a crash. They pay more for puts than for calls. Protection costs more than a lottery ticket.
Use this. Selling a put credit spread pays more than a call credit spread at the same strike distance. This is a structural feature. It gives sellers of put premium an edge.
How to Read IV Before You Enter Any Trade
Read IV by looking at its history. Compare it to stock movement. Use this check:
- Check the IV Level. Look at the number. SPY at 25% is high. A biotech stock at 25% is low. Context matters.
- Compare IV to Historical Volatility (HV). If IV is 60% and HV is 30%, options are expensive. They price in double the actual move. This is a setup for sellers.
- Calculate the Implied Move. Look at the price of the at-the-money (ATM) straddle. If a $200 stock has an ATM straddle at $12, the market expects a $12 move. Research from tastytrade shows stocks stay inside this range most of the time. We sell premium outside this range.
The IV Percentile Rule: Your Go/No-Go Filter
The IV Percentile shows how current IV compares to its one-year range. This tells you if volatility is high for that stock. Use it as a filter.
- IV Percentile above 50% → Green Light. This is the "50 Rule." Premium is rich. Selling gives you a statistical tailwind.
- IV Percentile below 30% → Red Light. Premium is cheap. Risk outweighs reward. We wait.
This filter stops you from selling cheap premium. It stops you from buying before a crush. It improves your odds.
Putting It Together: A Realistic Path to Consistent Cash Flow
A rules-based process turns trading into a cash flow engine. Focus on high-probability setups. Manage risk. Forget heroics.
- Screen for Opportunity: Find liquid stocks with an IV Rank ≥ 50%.
- Calibrate Strikes with Data: Use the ATM straddle price to find the expected move.
- Sell Premium Outside the Range: Sell a put credit spread. Put your short strike outside the expected move. Collect a credit of one-third the strike width.
- Define and Control Risk: Know your risk at entry. Cap risk at ≤2% of your account per trade.
- Let Theta Work: Time decay pays the seller. High IV makes this faster.
At Cash Flow University, we use this for every trade alert. See IV analysis in real time on the CFU blog. We break down live examples.
Do not chase one big win. Seek a small, repeatable edge.
Frequently Asked Questions
What is implied volatility in simple terms?
It is the price of uncertainty. It is the market prediction of future movement. Higher IV makes options expensive.
Why do options lose value even when the stock moves my way?
IV crush is the cause. IV spikes before events and drops after. This drop kills value faster than the stock move adds it.
What's the difference between Implied and Historical Volatility?
IV is forward-looking and based on option prices. HV is backward-looking and based on past stock prices. Sell options when IV is higher than HV.
Is high implied volatility good or bad?
It depends. High IV is a headwind for buyers. It is a tailwind for sellers. Sellers get more credit and faster decay.
What is IV Rank and why does it matter?
It shows where IV sits in its yearly range. A rank of 80% means options are expensive. This is the time to sell.
Is it ever a good idea to buy options when IV is high?
Only if you expect a massive move that beats market expectations. This is a low-probability play.
How do I find IV for a stock?
Check the option chain on your platform. IV Rank and Percentile are standard tools. Check them before every trade.
See how I apply IV to real trades at joincfu.com.